
Figure 1.
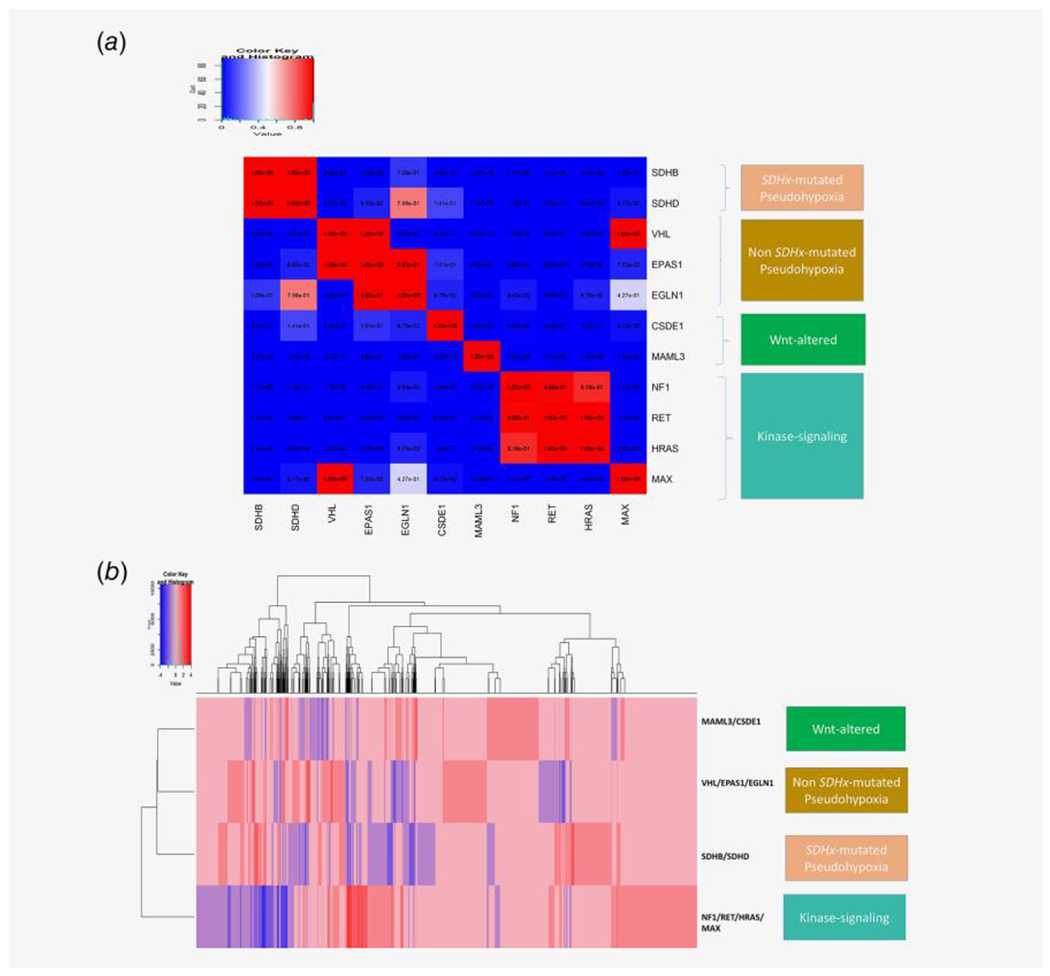
(a) lincRNA expression changes (upregulation or downregulation) in presence of different driver alterations in PCPG is calculated from PCPG TCGA tumor samples. For each of the 11 driver alterations shown in the figure, the mutual exclusivity of lincRNA upregulation and downregulation between each of the driver mutation groups are calculated using a hypergeometric test against the null hypothesis that same lincRNAs are upregulated (or downregulated) between different driver alteration groups (e.g., the lincRNAs upregulated (or downregulated) in SDHB mutated vs. non-SDHB mutated groups are compared against the lincRNAs upregulated (or downregulated) in VHL mutated vs. non-VHL mutated groups; and the same comparison is done between all driver mutation groups). For each comparison, a significant hypergeometric p-value (<0.05) reflects the fact that lincRNAs upregulated (or downregulated) between the driver mutation groups are distinct; and a high p-value (close to 1) reflects that the lincRNAs upregulated (or downregulated) between the driver alterations are very similar. In the figure the hypergeometric p-values between each driver mutation groups are plotted as an n*n heatmap; where the rows and columns denote driver mutation groups in PCPG and each cell shows the hypergeometric p-value for common lincRNA up-/down-regulation between the corresponding mutation groups in the respective row and column. The gradient blue to red denotes the hypergeometric p-value in the range 0–1. The driver alteration groups having distinct lincRNA up-/down-regulation signatures between them have significantly low hypergeometric p-values (<0.01), denoted as cells having dark blue color; whereas the driver alteration groups having common lincRNA up-/down-regulation signatures between them have high p-values between them, denoted as cells having red colors. We grouped the PCPG driver alteration groups belonging to four molecular subtypes of PCPG; SDHx-mutated pseudohypoxia (SDHB, SDHD), non-SDHx-mutated pseudohypoxia (VHL, EPAS1, EGLN1), Wnt-altered (MAML3, CSDE1) and kinase-signaling (NF1, RET, HRAS, MAX). (b) We plotted the signature of up-/down-regulation of lincRNA expression among the PCPG driver mutations grouped according to known molecular classification SDHx-mutated pseudohypoxia (SDHB/SDHD), non-SDHx-mutated pseudohypoxia (VHL/EPAS1/EGLN1), Wnt-altered (MAML3/CSDE1), and kinase-signaling (NF1, RET, HRAS, MAX), with minimal overlap between upregulated lincRNAs in each driver mutation group.