
Figure 1.
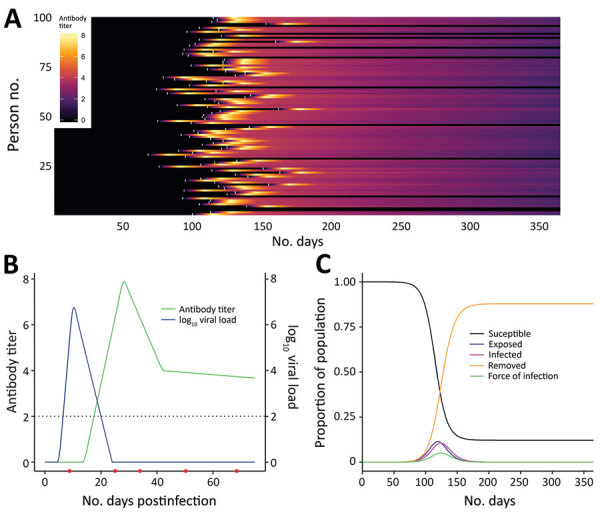
Link between severe acute respiratory syndrome coronavirus 2 infection dynamics and antibody levels in the population. A) Each line shows a person’s antibody titer. After infection, each person’s antibody levels undergo a dynamic process. A lag occurs from time of infection (white marks) to the generation of antibodies, which peaks several weeks postinfection and varies across persons depending on the time since infection and the parameters governing dynamics of the immune response. B) Antibody and virus dynamics in a person from time of infection. Frequent follow-up samples from the same person (indicated by red dots along the horizonal axis) would inform models of viral load and antibody kinetics. The dashed horizontal line represents the limit of detection of the assay. Early on, viral loads are more sensitive for diagnosing recent infection, whereas antibody titers become more sensitive once the humoral response is mounted and persons recover. C) Severe acute respiratory syndrome coronavirus 2 infections generated under an epidemic process (using a susceptible-exposed-infectious-removed model), modelling susceptible, exposed, infected, and recovered persons.