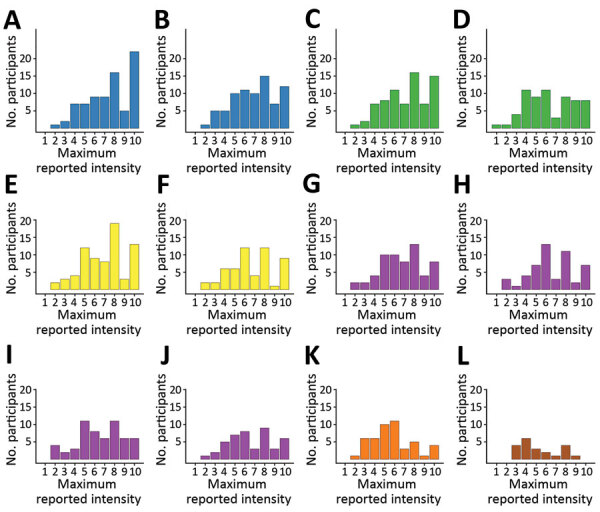
Figure 2.

Histograms of maximum reported symptom intensities for participants tested for heterogeneity of dengue illness in community-based prospective study, Iquitos, Peru. Persons who did not report symptoms were excluded. Colors in histograms correspond to symptom groups defined in Appendix Figure 1. Values for each panel are no. (%) of participants who reported the specific symptom at any time during their illness. A) malaise, 78 (98.7); B) weakness, 76 (96.2); C) fever, 74 (93.7); D) chills, 65 (82.3); E) headache, 72 (91.1); F) retroorbital pain, 54 (68.4); G) body pain, 61 (77.2); H) bone pain, 51 (64.6); I) muscle pain, 57 (72.2); J) joint pain, 45 (57.0); K) abdominal pain, 47 (59.5); L) sore throat, 21 (26.6).
