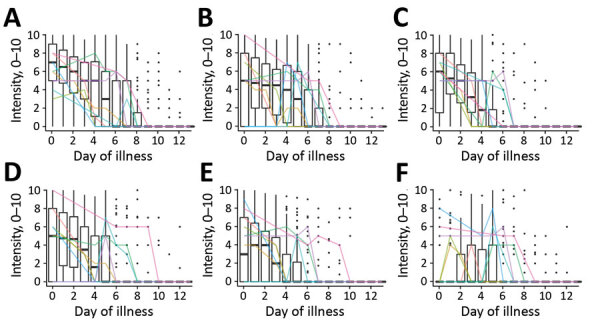
Figure 3.

Symptom intensities (scale 1–12) for 6 symptoms over the first 14 days of illness (0–13) for participants tested for heterogeneity of dengue illness in community-based prospective study, Iquitos, Peru. A) Malaise; B) weakness; C) fever; D) headache; E) body pain; F) abdominal pain. Box plots indicate trends for the study population as a whole. Dark horizontal lines indicate median, upper limit of box indicates 75th percentile, lower limit of box indicates 25th percentile, upper whisker extends to the largest value <1.5 times the interquartile range; and lower whisker extends to the smallest value >1.5 times the interquartile range. Black dots indicate individual scores. Colored lines indicate trajectories for a random sample of 10 individual participants.
