
Fig. 3.
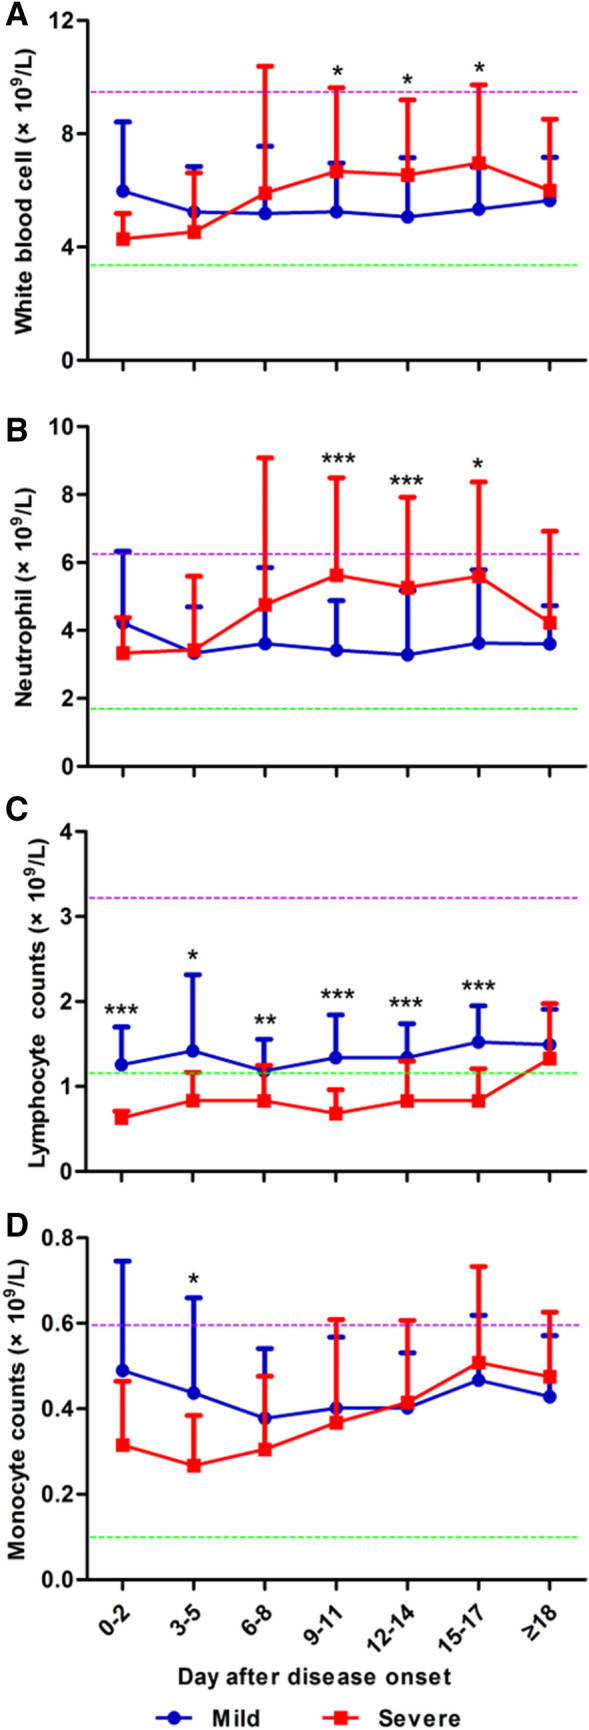
Kinetic analysis of cell counts of different populations of WBCs in COVID-19 patients. The absolute numbers of white blood cells (a), neutrophils (b), lymphocytes (c) and monocytes (d) in the peripheral blood of mild (blue line) and severe (red line) COVID-19 patients were analyzed at different time points after the disease onset. *P < 0.05; **P < 0.01; ***P < 0.001. The upper (purple line) and lower (green line) limits of normal values and the means ± SD are given in the graph. Results were tested for significance by t test or Mann–Whitney U test. A P value < 0.05 is considered as significant