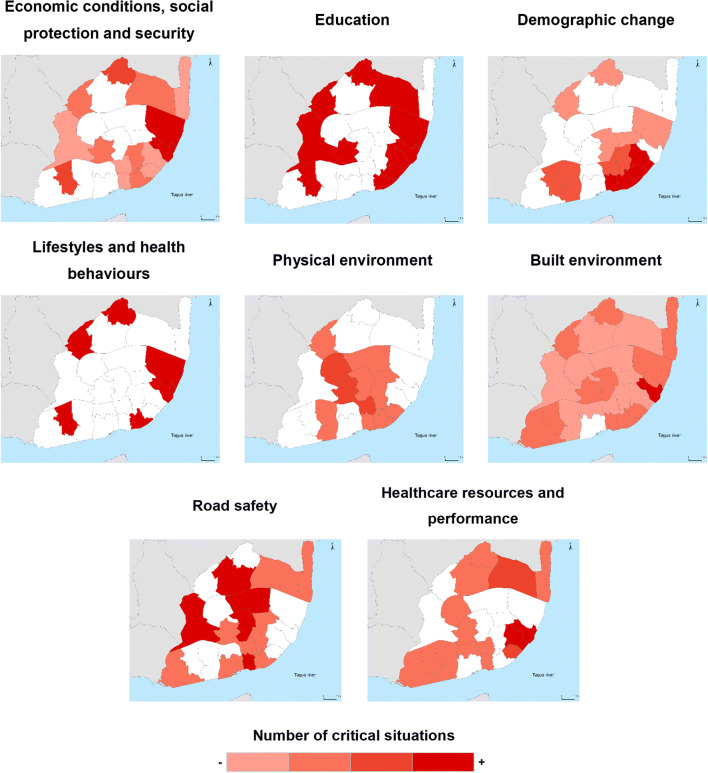
Fig. 7.
Geographical distribution of identified critical situations by intervention axis, in the municipality of Lisbon. Note: Civil parishes are coloured using a monochromatic colour scheme with a gradient ranging from light red to dark red according to the number of indicators identified by the majority as a critical situation. Civil parishes in light red were marked as critical in less than 25% of the indicators selected in the intervention axis. Civil parishes in dark red were marked as critical in more than 75% of the selected indicators. Civil parishes in white were not marked red for any indicator of the intervention axis.

