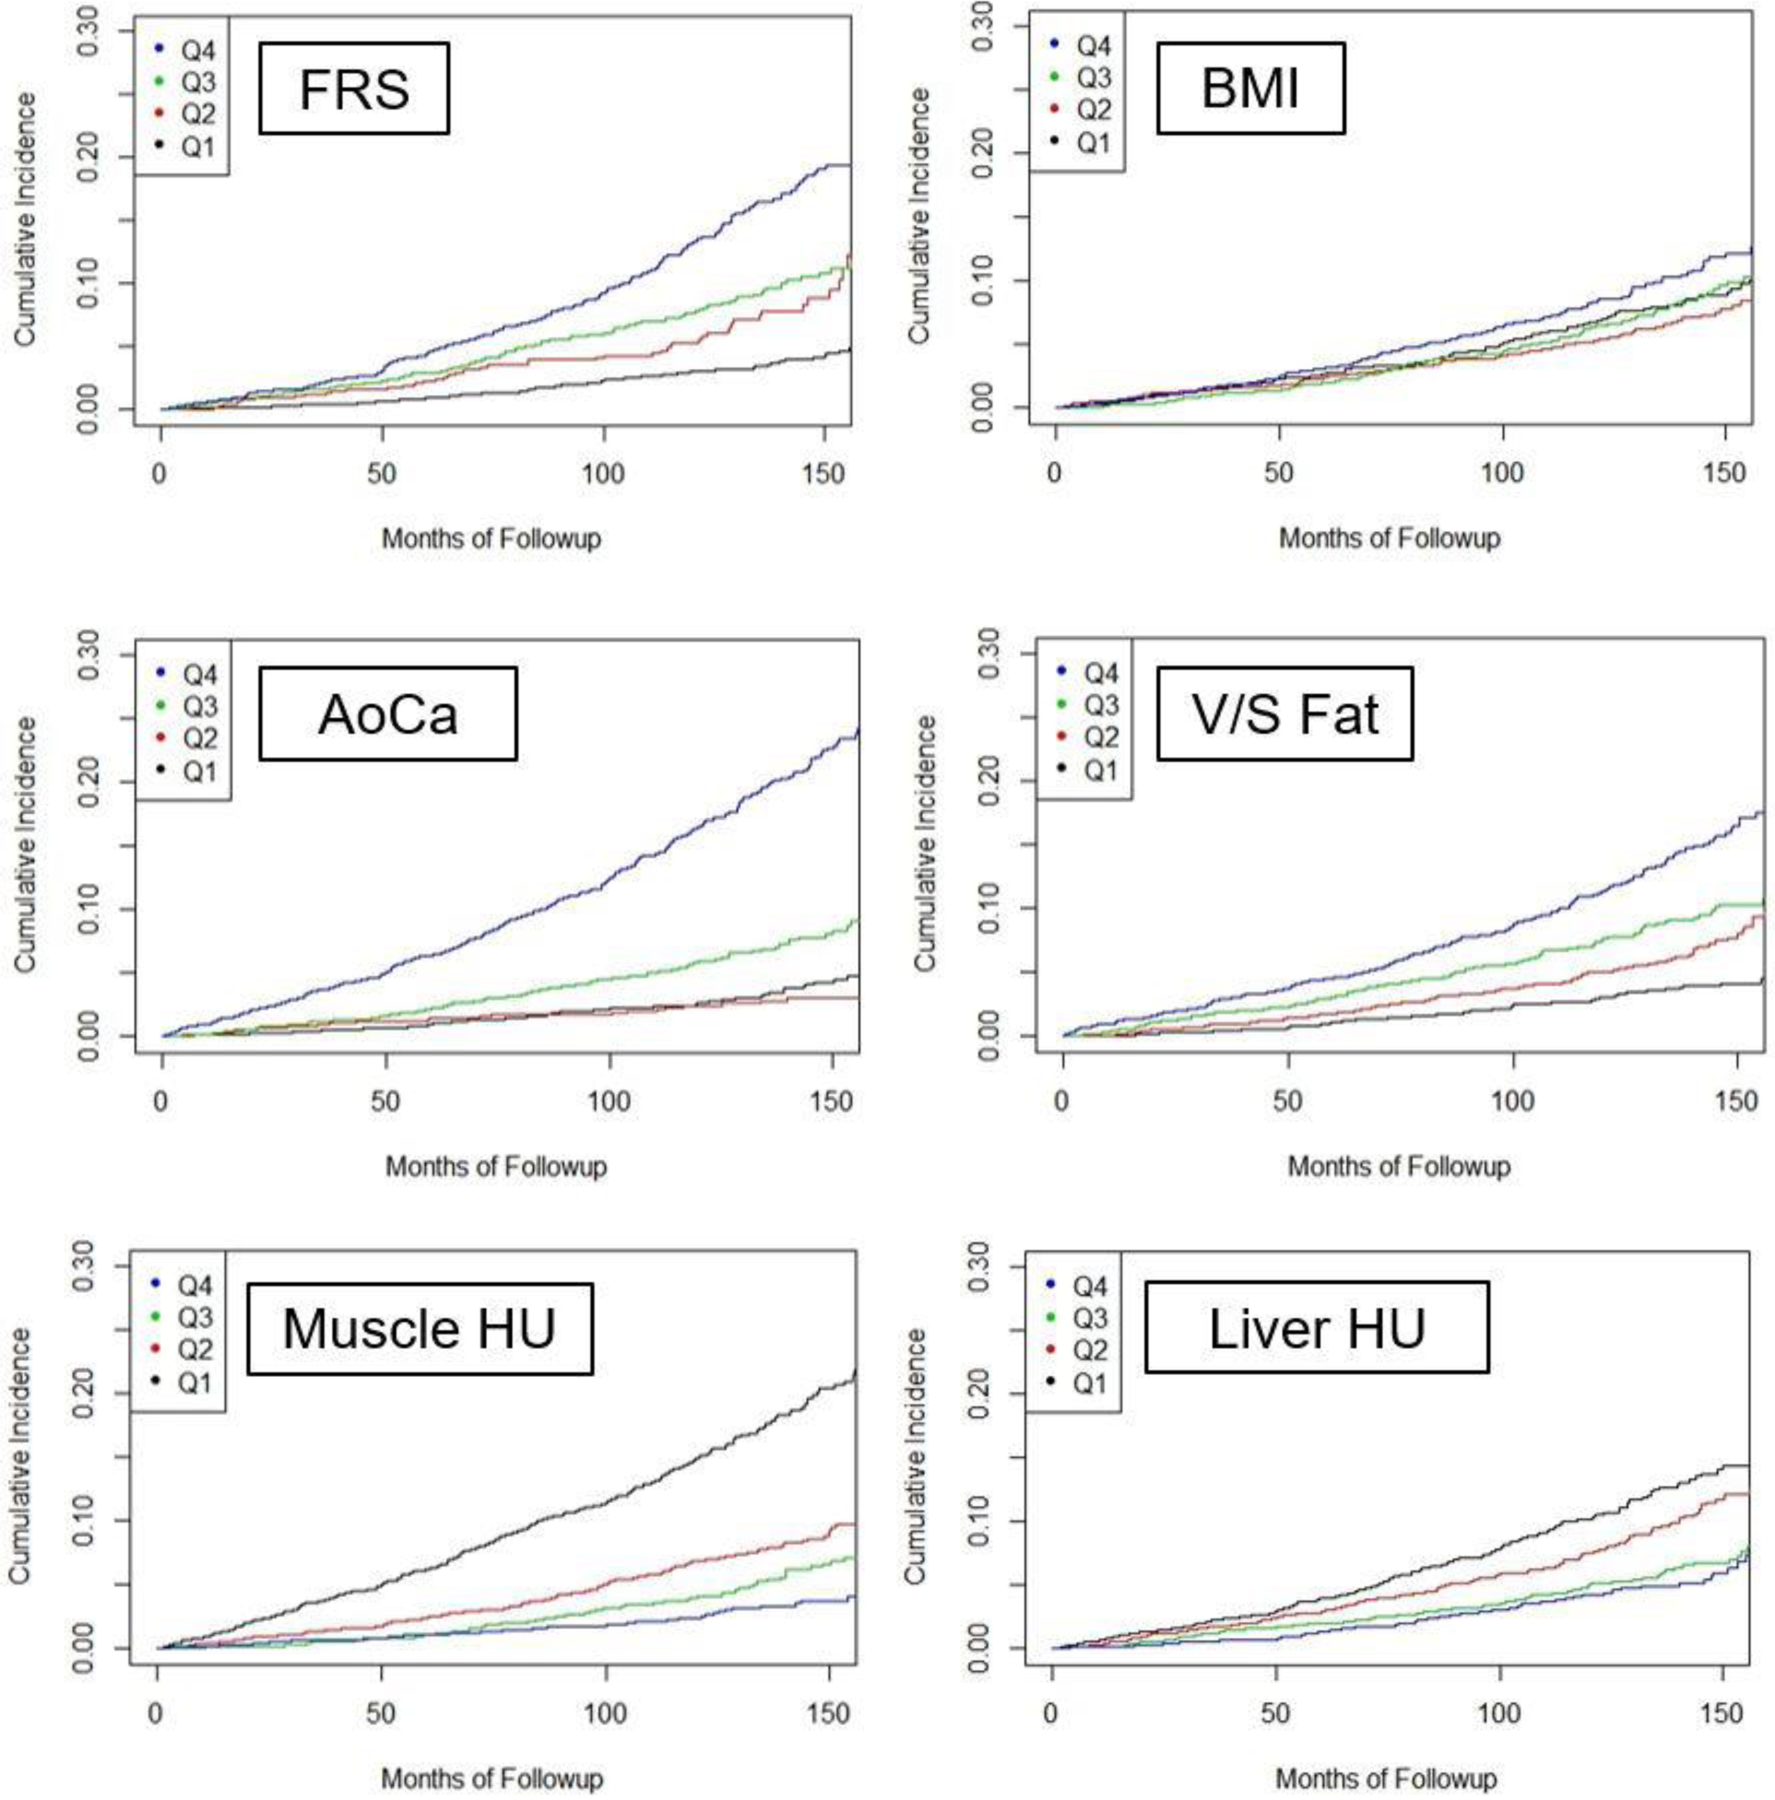
Figure 3. Kaplan-Meier time-to-death plots by quartile for clinical parameter and univariate CT biomarkers.

Good separation between the “worst” versus other quartiles over time was observed for the automated aortic calcium and muscle density values. Quartile separation was less pronounced for the CT-based fat and liver measures, but each is noticeably better than BMI. The L1 BMD results are not shown but separation of the worst quartile was comparable to muscle assessment.
