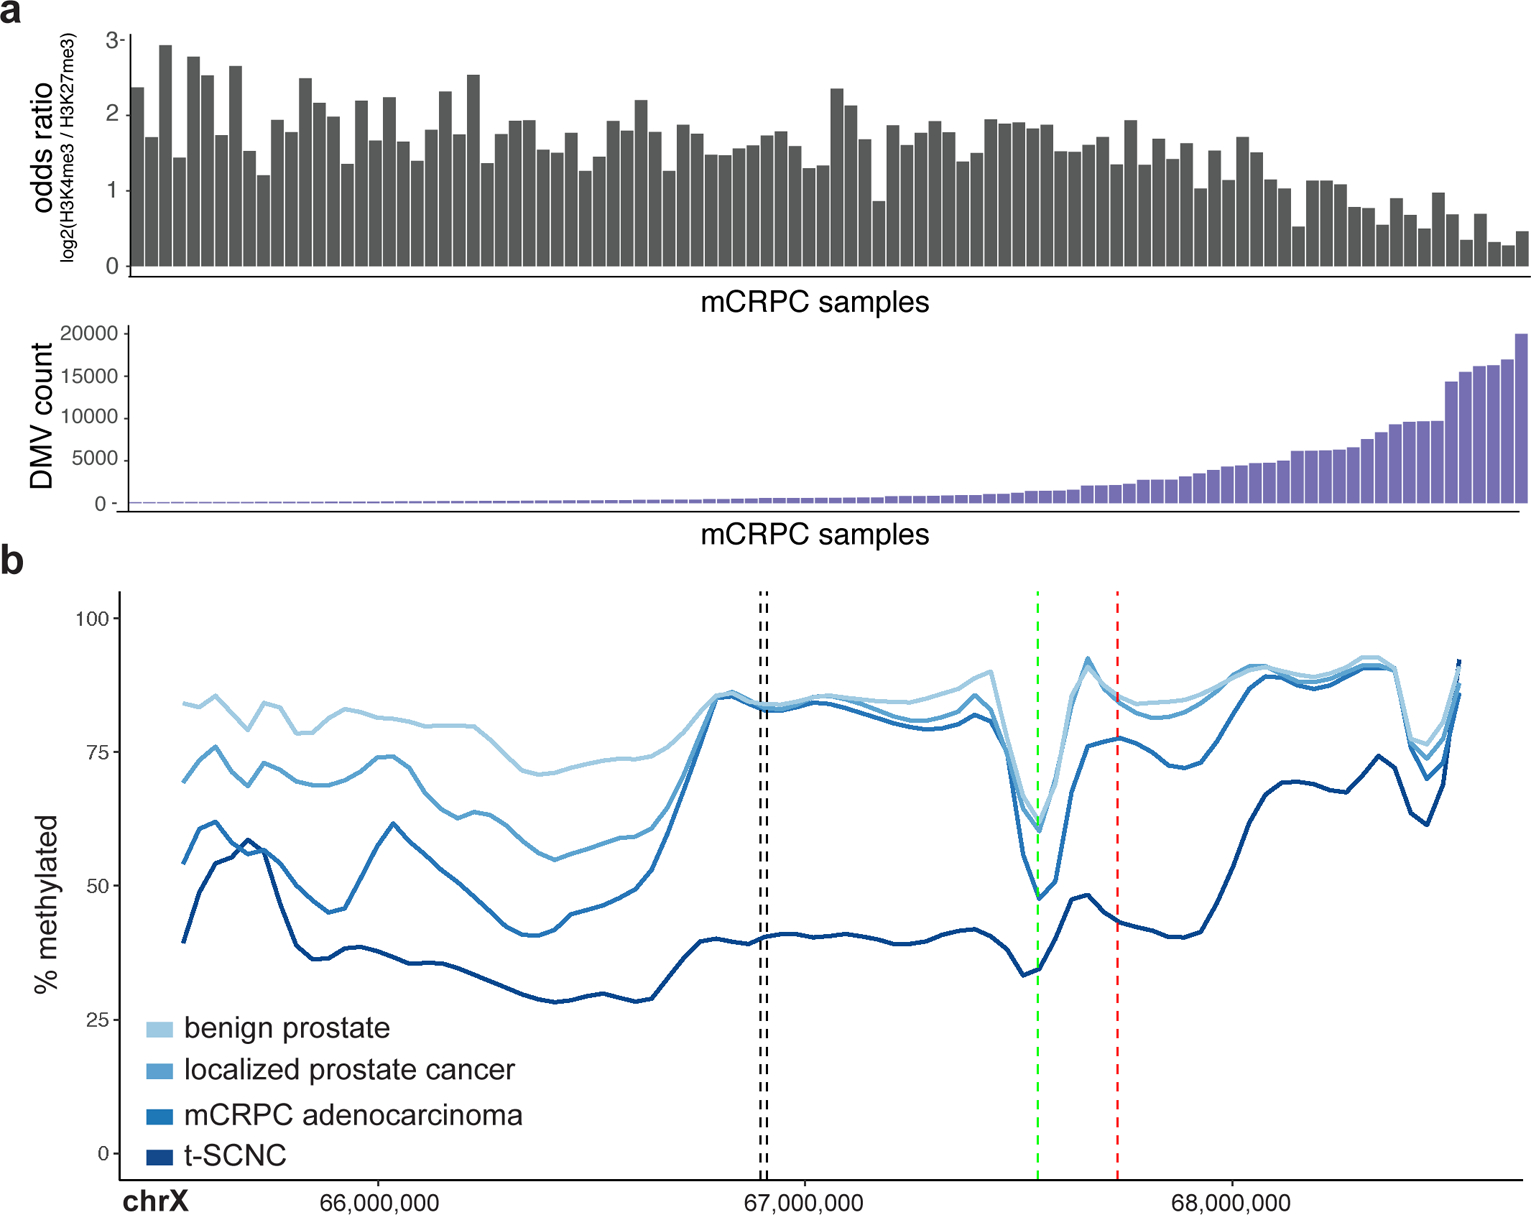
Figure 2: DNA methylation valleys (DMVs).

a, Top: Sample-level log2 odds ratio calculated from the number of DMVs which overlap H3K4me3 vs. H3K27me3 sites. Lower values favor H3K27me3, higher values favor H3K4me3. Bottom: Sample-level count of DMVs in order matching top panel. b, Mean percent methylation across the AR locus for benign prostate (N=4), localized prostate cancer (N=5), mCRPC adenocarcinoma (N=95), and t-SCNC samples (N=5). Vertical black lines show the location of the previously identified AR enhancer17. The vertical green and red lines show the TSS and transcriptional terminator of the androgen receptor, respectively.
