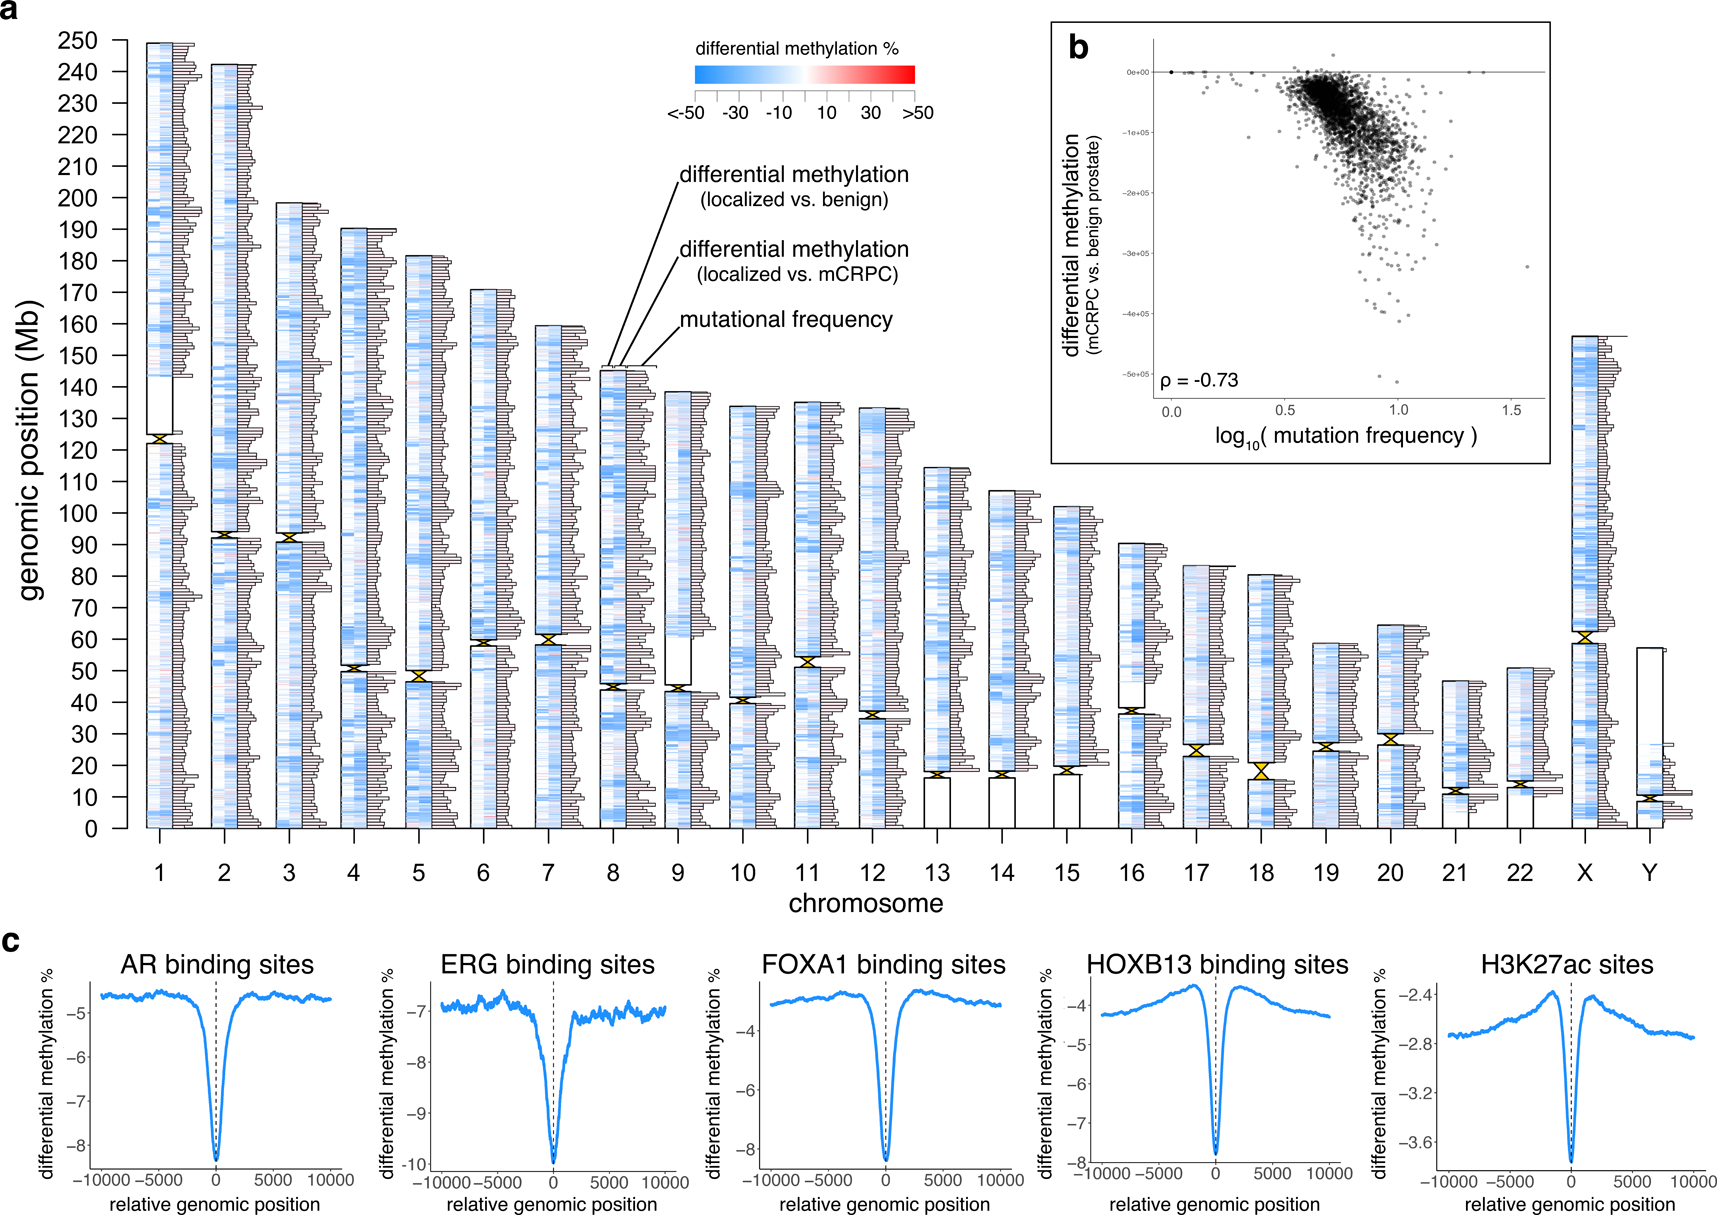
Figure 6: Genome-wide analysis of differential methylation.

a, Differentially methylated regions (DMRs) and mutation frequency in mCRPC. Ideogram shows, for each chromosome, from left to right: DMRs comparing primary prostate cancer (N=5) to benign prostate (N=4), DMRs comparing mCRPC (adenocarcinoma, N=95) to primary prostate cancer (N=5), and mutational frequency in 1Mbp windows in the mCRPC samples (excluding two hyper-mutated samples17). Maximum bar height in mutation frequency represents an average mutational frequency ≥10 mutations per Mb per sample.
b, Differential methylation (comparing mCRPC (adenocarcinoma) to benign prostate) compared to mutational frequency (excluding 2 hyper-mutated samples17), N=98. Each point represents a fixed 1Mbp window of the genome, and all points collectively represent all 1 Mb windows across the genome excluding centromeres and telomeres.
c, Average differential methylation values across all sites identified from publicly available ChIP-seq data (AR36, ERG38, FOXA137, HOXB1337, H3K27ac35). For each ChIP-seq peak, a 20Kbp window centered on midpoint of the peak (x=0) was assessed for differential methylation between mCRPC adenocarcinoma vs. benign prostate samples.
