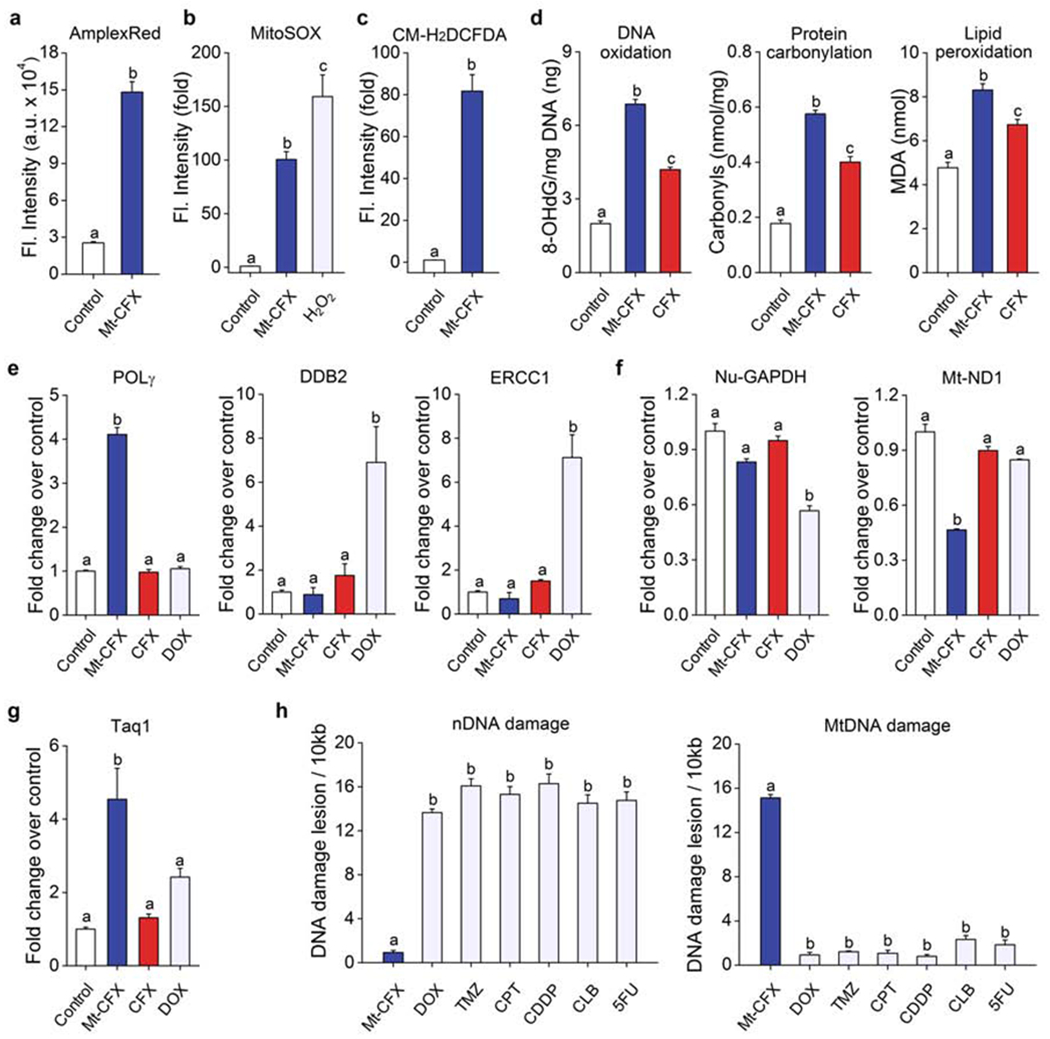
Figure 3. Mt-CFX induces mitochondrial ROS production with minimal nuclear DNA damage.

(A) Confocal microscopic fluorescence intensity of MDA-MB-231 cells treated with Mt-CFX (30 μM) or a control co-incubated with 400 μM Amplex Red® for 30 min (n = 6).
(B) Confocal microscopic fluorescence intensity of Mt-CFX (30 μM) or control-treated MDA-MB-231 cells incubated with 5 μM Mito-Sox for 15 min (n = 5).
(C) Confocal microscopic fluorescence intensity of Mt-CFX (30 μM) or control treated MDA-MB-231 cells incubated with 10 μM CM-H2DCFDA for 30 min (n = 15).
(D) ELISA DNA oxidation and protein carbonylation assay results of MDA-MB-231 cells treated with 30 μM Mt-CFX, CFX as well as control samples. Colorimetric malondialdehyde (MDA) assay results, as a measure of lipid peroxidation, of similarly treated MDA-MB-231 cells.
(E) q-PCR analysis of DNA repair genes in MDA-MB-231 cells treated with 30 μM Mt-CFX, CFX, DOX, and control samples.
(F) q-PCR analysis of housekeeping genes in MDA-MB-231 cells treated with 30 μM Mt-CFX, CFX, DOX, and control samples.
(G) Taq1 restriction site mutation assay using MDA-MB-231 cells treated with 30 μM Mt-CFX, CFX, DOX, and control samples.
(H) Long-range q-PCR DNA lesion assay using MDA-MB-231 cells treated with Mt-CFX (30 μM), temozolomide (TMZ) (1 μM), camptothecin (CPT) (250 nM), cis-platin (CDDP) (3 μM), chlorambucil (CLB) (50 μM), and fluorouracil (5-FU) (30 μM), respectively. Concentrations were selected on the basis of their respective IC50 values.
Data are represented as mean ± SEM. (n = 3, unless specified otherwise). Statistical significance was determined using a one-way ANOVA test with post-hoc Bonferroni test. Different letters (e.g., a–d) signify data which are statistically different (p < 0.05).
