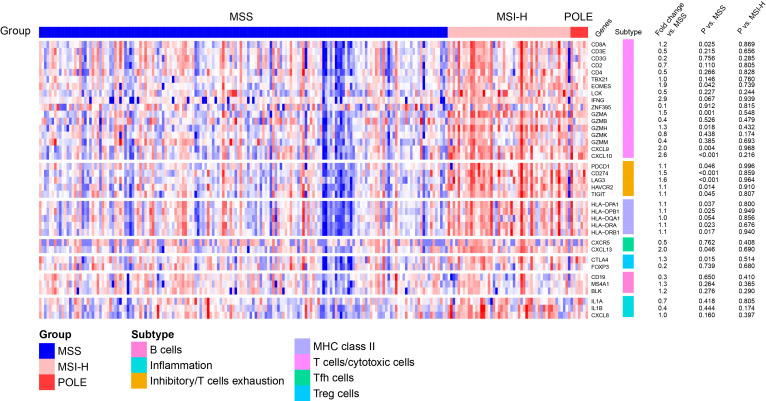
Figure 1.
T cell response according to tumor molecular subtype of stage II CRCs in TCGA. Heatmap showing expression of immunological genes according to pole EDMs, MSI-H and MSS three subgroups. CRCs, colorectal cancer; EDMs, exonuclease domain mutations; MSI-H, microsatellite instability-high; MSS, microsatellite stable; TCGA, the Cancer Genome Atlas.

