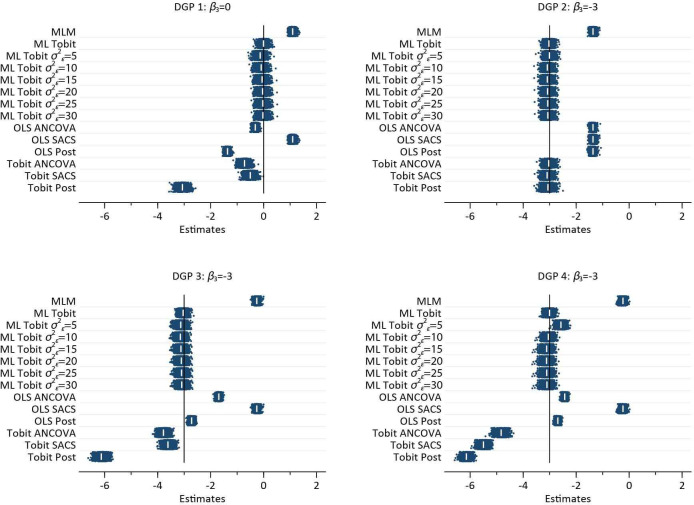
Figure 4.
Plot of 1000 estimates by each DGP, for each method of analysis. Within each method, the vertical axis is the repition number of each simulated dataset. The white pipe symbol is the average of the estimates. ANCOVA, analysis of covariance; DGP, data generating process; MLM, multilevel model; OLS, ordinarily least squares; SACS, Simple Analysis of Change Scores.

