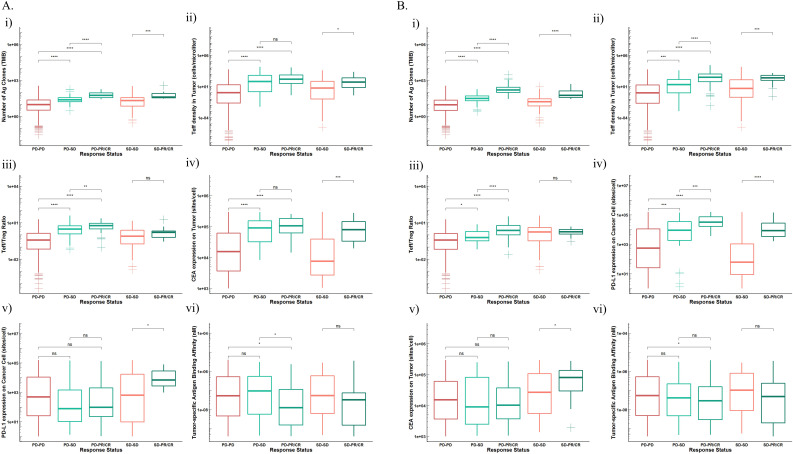
Figure 5.
Distributions of potential biomarkers in VPS subgroups (PD-PD, PD-SD, PD-PR/CR, SD-SD, SD-PR/CR) receiving (A). Atezolizumab monotherapy versus combination therapy. (i) TMB; (ii). teff density in tumor; (iii). Teff/Treg ratio in tumor; (iv). CEA expression in cancer cells; (v). PD-L1 expression in cancer cells; (vi). tumor-specific antigen binding affinity. (B) Cibisatamab monotherapy versus combination therapy. (i). TMB; (ii) teff density in tumor; (iii) Teff/Treg ratio in tumor; (iv) PD-L1 expression in cancer cells; (v) CEA expression in cancer cells; (vi). Tumor-specific antigen binding affinity. CEA, carcinoembryonic antigen; NS, not significant; PD1, programmed cell death protein 1; PD-L1, PD-ligand 1; TMB, tumor mutational burden; VPS, virtual patients. * P ≤ 0.05, ** P ≤ 0.01, *** P ≤ 0.001, **** P ≤ 0.0001.

