Figure 7.

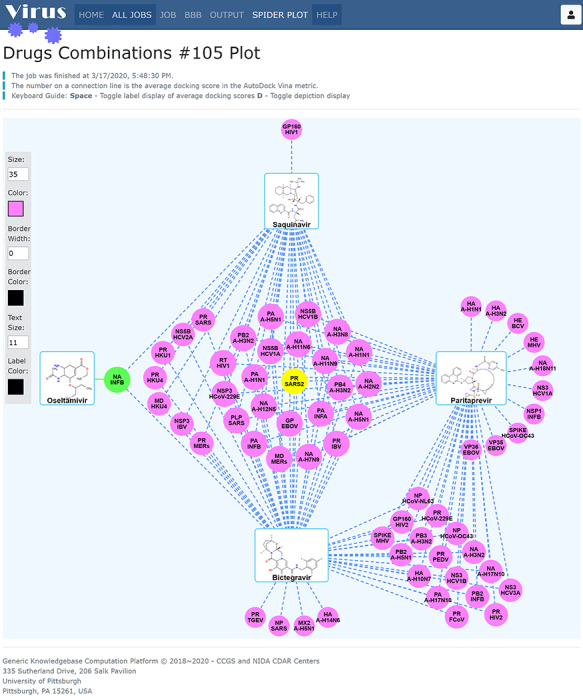
Spider Plot for data virtualization and analysis for three antiviral drugs. The average docking scores are displayed as connection labels and the protein targets on which the query compound is active are displayed as circular discs.

Spider Plot for data virtualization and analysis for three antiviral drugs. The average docking scores are displayed as connection labels and the protein targets on which the query compound is active are displayed as circular discs.