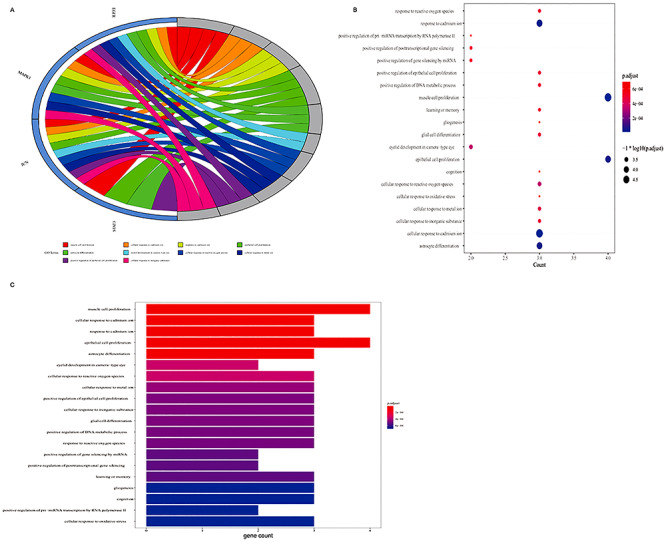
Figure 4.

Biological process (BP) from bioinformatics data showing the top 20 BPs of VC action against sepsis. With the use of R-language packages, the four core targets were reassayed for GO-based biological function enrichment. (A) The blue Circro circles show the genes enriched in the top 10 items, and a total of top 10 BP enrichment items. (B) The bubble diagram shows the top 20 BP enrichment data. The x-axis represents the gene ratio and the intensities of different colors represent the adjusted P-value. (C) The histograms show the top 20 BP enrichment results. The x-axis represents the enriched gene count and the intensities of different colors represent the adjusted P-value.
