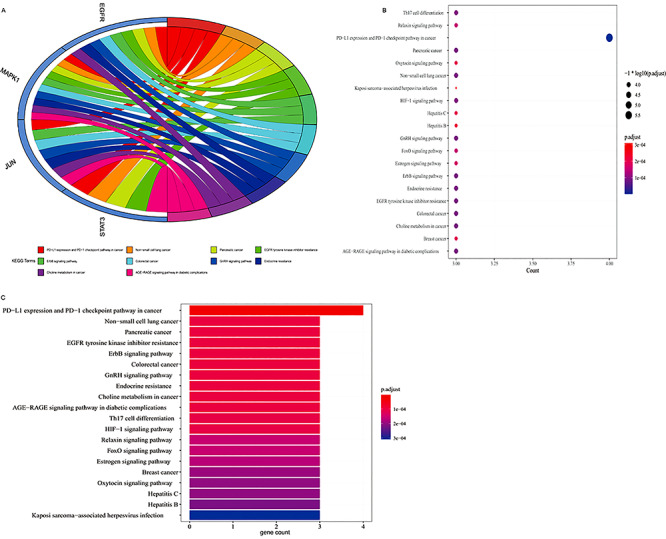
Figure 5.

Detailed molecular pathways from bioinformatics findings exhibited the top 20 KEGG pathways of VC action against sepsis. Using the R-language packages, the four core targets were reanalyzed to reveal the KEGG molecular pathways. (A) The blue Circro circles show the genes enriched in the top 10 KEGG items. (B) The bubble diagram shows the top 20 KEGG enrichment pathways; the x-axis represents the gene ratio and the intensities of different colors represent the adjusted P-value. (C) The histograms highlight the top 20 KEGG enrichment pathways. The x-axis represents the enriched gene count and the intensities of different colors represent the adjusted P-value.
