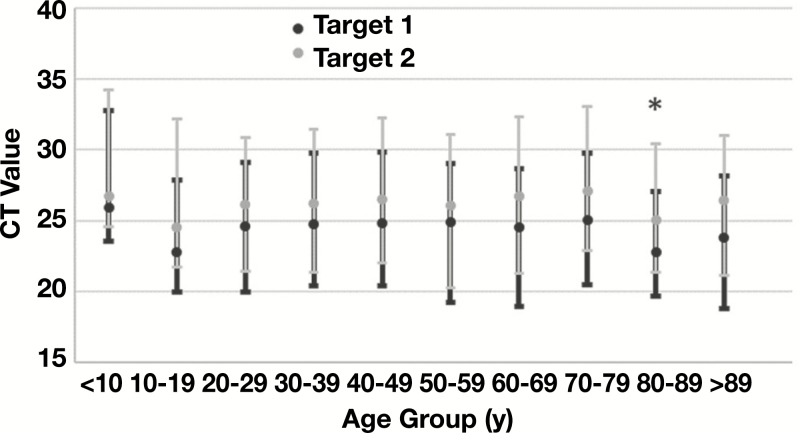
Figure 2.
Comparison of cycle threshold (CT) by age. The mean (dots) and interquartile range (whiskers) of CT values obtained for Target 1 and Target 2 are plotted for patients in the indicated age ranges. The mean value of Target 1 CTs was significantly lower than the cumulative mean of all Target 1 CT values (*P = .028) for patients age 80-89 years, indicating potentially higher viral load in these specimens.

