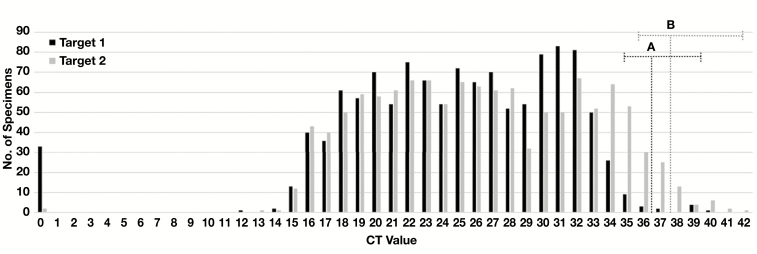
Figure 3.
Distribution of cycle threshold (CT) values. The total number of specimens with indicated CT values for Target 1 and 2 are plotted. The estimated limit of detection for (A) Target 1 and (B) Target 2 are indicated by vertical dotted lines. Horizontal dotted lines encompass specimens with CT values less than 3× the LoD for which sensitivity of detection may be less than 100%. This included 19/1,180 (1.6%) reported CT values for Target 1 and 81/1,211 (6.7%) reported CT values for Target 2. Specimens with Target 1 or 2 reported as “not detected” are denoted as a CT value of “0.”

