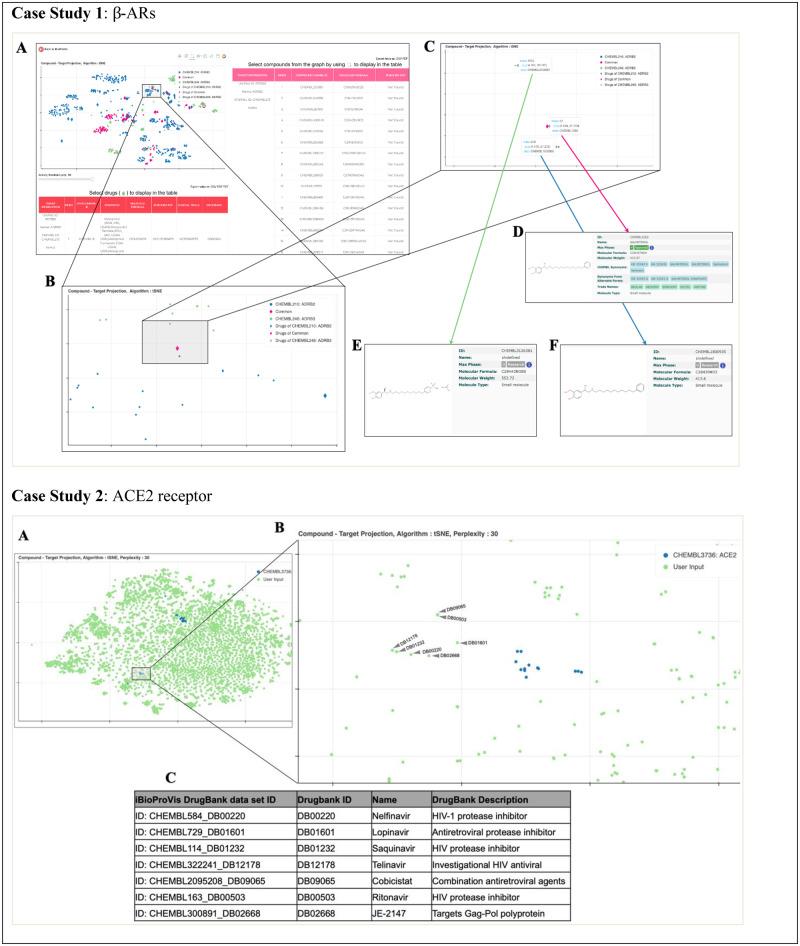
Fig. 1.
Comparative interactive embedding output of iBioProVis Case Study 1: β-ARs with β-adrenergic receptors (β-ARs). (A) ADRB2 (blue nodes) and ADRB3 (green nodes) with data tables of drugs (diamonds) and ChEMBL compounds (round circles). Common small molecules acting on β-ARs are represented with magenta-colored nodes. (B and C) Interactive zoom in to visual clusters and the nodes (D–F) Compounds in close vicinity share similar molecular structures. Case Study 2: ACE2 receptor binding 58 compounds (blue nodes) and 6516 small molecule drugs (green nodes) from DrugBank were embedded together (A). Compounds targeting ACE2 are clustered in two distinct groups. Seven antiviral drugs were closely embedded with one of the ACE2 cluster (B and C). The web link to the iBioProVis projection for Case Study 2 is given in the Supplementary Material. (Color version of this figure is available at Bioinformatics online.)

