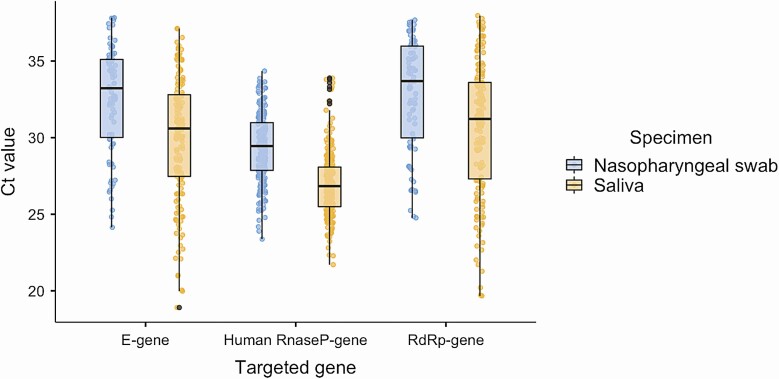
Figure 1.
Boxplots of SARS-CoV-2 Ct value (mean and interquartile range) of both E-gene and RdRp-gene of all the positive specimens. Ct values of both genes were lower in the saliva than nasopharyngeal swabs of studied asymptomatic individuals. Also included are Ct values of internal control (Human RnaseP-gene) of all the samples in both specimens. Abbreviations: Ct, cycle threshold; SARS-CoV-2, severe acute respiratory syndrome coronavirus 2.

