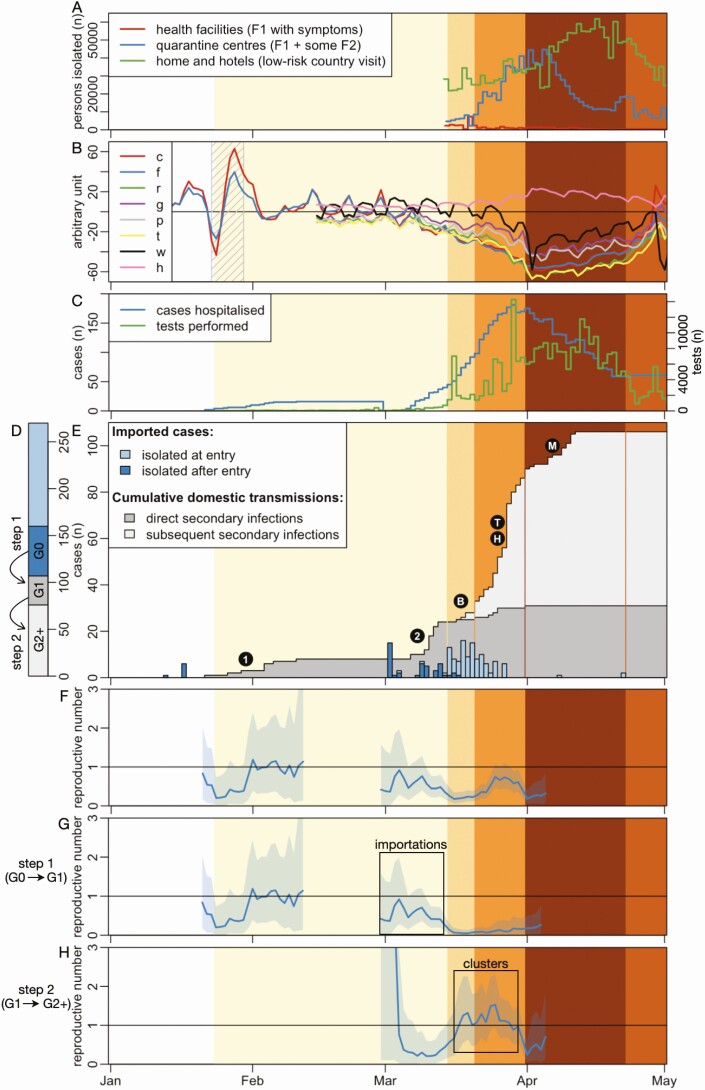
Figure 1.
Timeline of SARS-CoV-2 emergence and response in Vietnam. Background color reflects the intensity of the interventions taken by the Vietnam government to control the COVID-19 epidemic, with darker shades indicating more intense disease control measures. The main events of these periods are described in detail in Table 1. A, Number of people in isolation by day. B, Relative indexes of population movements: number of travellers by car (c), on foot (f) (both from Apple Mobility Data [13]), proxies of people in retail and recreation areas (r), in groceries stores and pharmacies (g), in parks (p), in bus transit stations (t), at work (w), and at home (h), all from Google Community Mobility Data [14]. Hashed area indicates the lunar New Year holiday (23–29 January). Traditionally, the first half of the week is spent at home with close family, whereas the second half of the week is dedicated to visits of members of the extended family. C, Number of SARS-CoV-2 positive cases hospitalised and RT-PCR tests performed by day. D, Cumulative number of detected SARS-CoV-2 positive cases in Vietnam, differentiating imported cases (G0) and whether they were isolated at entry or later, and locally transmitted cases and whether they were in direct contact with imported cases (G1) or not (G2+). E, Numbers of SARS-CoV-2 imported cases together with cumulative numbers of local transmissions. Circled characters indicate major internal transmission events: first introduction of SARS-CoV-2 virus in the country (1: 16 cases), second introduction (2: 15 cases), cluster of transmission in a Ho Chi Minh City bar (B: 19 cases), cluster of transmission in a large Hanoi hospital (H: 17 cases), community cluster of transmission linked to the Hanoi hospital through catering staff (T: 28 cases) and community cluster of transmission in Me Linh district in the north of Hanoi (M: 13 cases). F–H, Estimates of the reproduction number for the 2 epidemics. Panel G focuses only on the first step of the chain of transmission between G0 and G1, whereas panel H focuses on all the other steps of the chain of transmission. Panel F includes all detected cases. The shaded blue area shows the 95% confidence intervals. Abbreviations: COVID-19, coronavirus disease 2019; RT-PCR, reverse transcription polymerase chain reaction; SARS-COV-2, severe acute respiratory syndrome coronavirus 2.

