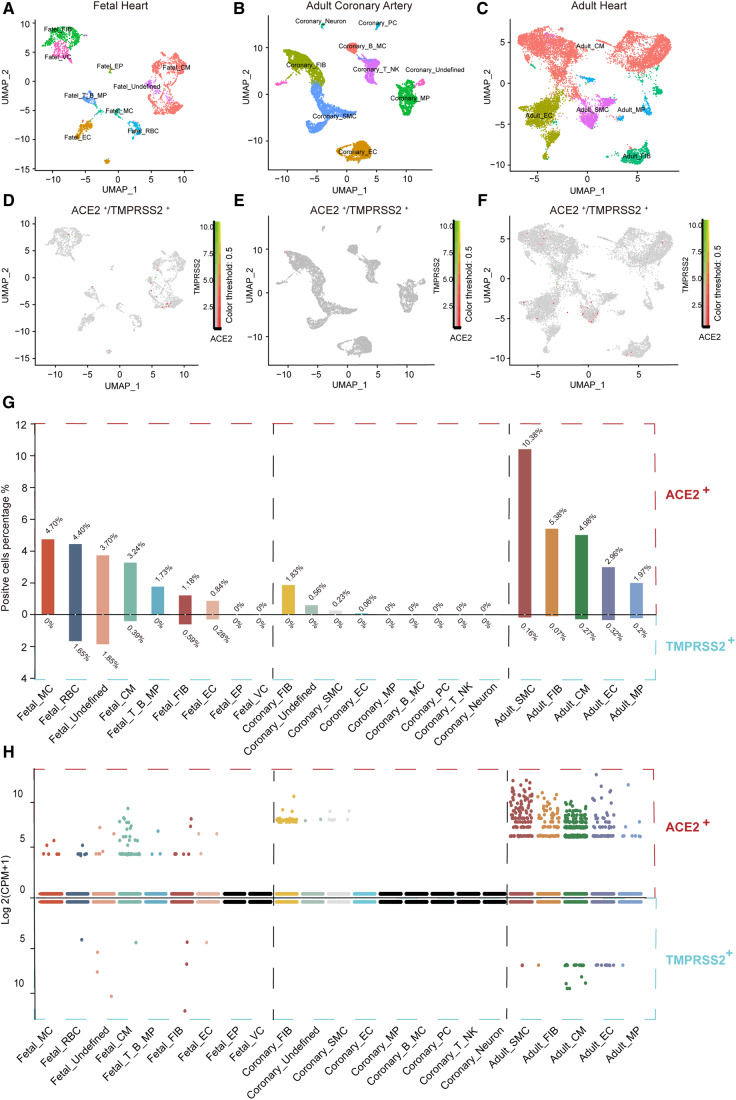
Figure 1.
ACE2 and TMPRSS2 are expressed in specific cell types in the human heart. (A–C) Foetal heart cell atlas (A), adult coronary artery cell atlas (B), adult heart cell atlas (C) visualized by UMAP, coloured by the main cell groups. (D–F) Expression profile of ACE2 and TMPRSS2 in subset cell groups of the foetal heart (D), adult coronary artery (E), and adult heart (F); green represents the expression of TMPRSS2, red represents the expression of ACE2, and yellow represents the co-expression of ACE2 and TMPRSS2. (G) Percentage of ACE2- and TMPRSS2-positive cells in each subset cell group (nine cell groups in foetal heart, nine in adult coronary artery, and five in adult heart). (H) The expression of ACE2 and TMPRSS2 in each subset cell group. The expression level is displayed as log 2(CPM + 1). MC, mast cell; RBC, red blood cell; CM, cardiomyocyte; B, B cell; T, T cell; FIB, fibroblast; EC, endothelial cell; EP, epicardial cell; VC, valvular cell; SMC, smooth muscle cell; MP, macrophage; PC, pericyte; NK, natural killer cell; ACE2, angiotensin-converting enzyme 2; TMPRSS2, transmembrane protease serine 2; CPM, counts per million.

