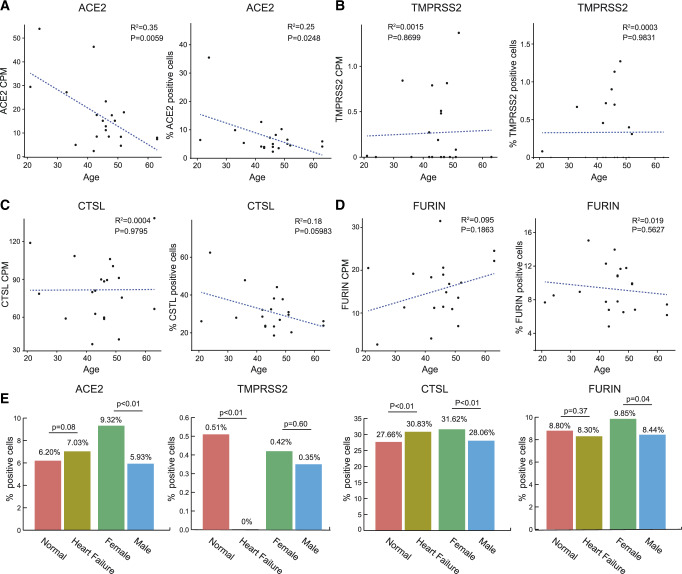
Figure 3.
Age, sex, and disease as possible factors influencing ACE2 expression. (A–D) Average ACE2 (A), TMPRSS2 (B), CTSL (C), and FURIN (D) expression value (left) and percentage of the above positive genes (right) over all individual samples vs. age in adult heart cells; points represent individual samples (n = 20). (E) Bar plot showing the comparison of the percentage of positive ACE2, TMPRSS2, CTSL, and FURIN cells in normal and heart failure hearts, as well as in female and male hearts. The significance of correlations was tested by using linear regression. Differences in the percentage of specific gene-positive cells between the two groups were tested using χ2 test. The P-values are shown in the figure.

