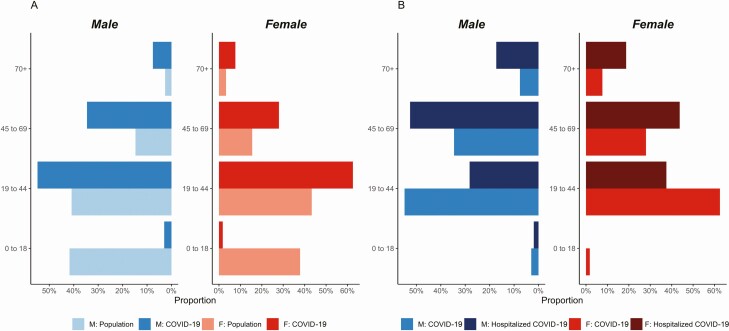
Figure 1.
Distribution of COVID-19 cases and hospitalized cases. A, San Pedro Sula population distribution with distribution of COVID-19 cases. M: Population represents the proportion of males in the population bins (blue) and F: Population represents the proportion of females in the population (red). M: COVID-19 and F: COVID-19 represent the proportions of males and females with confirmed COVID-19 cases. B, Hospitalized COVID-19 proportion of cases compared to COVID-19 proportions of cases overall. Abbreviation: COVID-19, coronavirus disease 2019.

