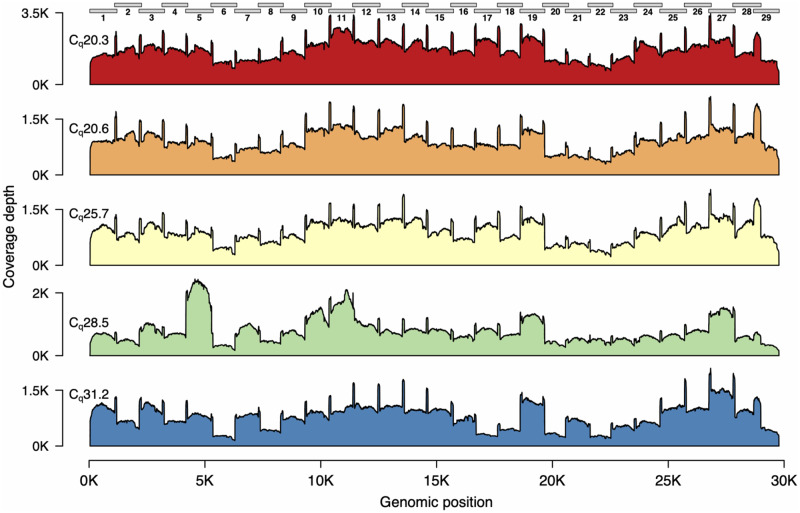
Figure 3:
Genome coverage plots for patient samples varying in Cq values. The plots indicate the genome coverage for the 1200 bp amplicon set for samples with Cq values ranging from 20.3 to 31.2. For all samples, minimum coverage exceeds 50 at all genomic positions (excluding the 5′- and 3′-UTR). Note that the scale of the y-axes varies between plots. The locations of the amplicons are indicated above the first plot.

