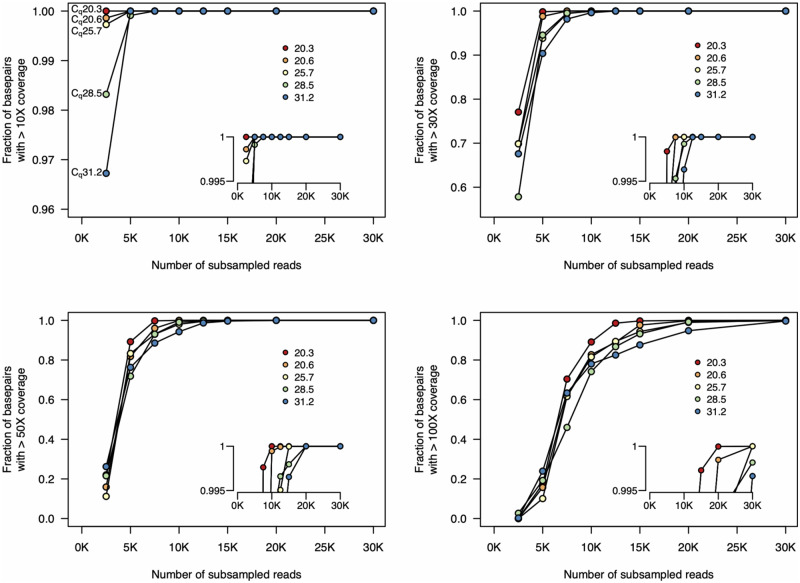
Figure 4:
Fraction of genome covered at different sequencing depths. We subsampled from the complete set of unfiltered reads and mapped these reads to the reference sequence. For all five samples, 30× coverage of all genomic positions is achieved with only 12.5 K reads. And 50× coverage at all genomic positions is achieved with <20 K reads. Insets show genome coverage levels at the top end of the y-axis (range from 0.995 to 1). Each line indicates the coverage for one sample. Insets show higher resolution at the upper limit of the y-axis. The colours of each sample on these plots are the same as those in Fig. 3. Note that the scale of the y-axis in the top left plot differs from the others.

