
FIGURE 3.
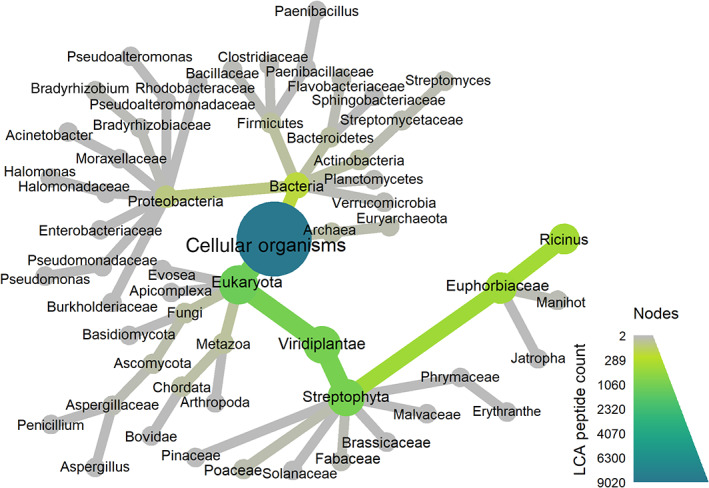
Dendrogram visualization of the results of a UniPept taxonomy analysis on a single liquid chromatography–tandem mass spectrometry (LC–MS/MS) replicate of a ground castor seed sample. Each node represents a taxon and the area and color are proportional to the number of peptides whose LCA (lowest common ancestor) is at that taxon or lower. The size and color of the edges represent the same information. For simplicity only the superkingdom, kingdom, phylum, family, and genus ranks with at least two LCA peptides are shown. De novo peptides map to many taxa, but only in the lineage of the castor plant Ricinus communis are high numbers of matching de novo peptides observed