Figure 1.
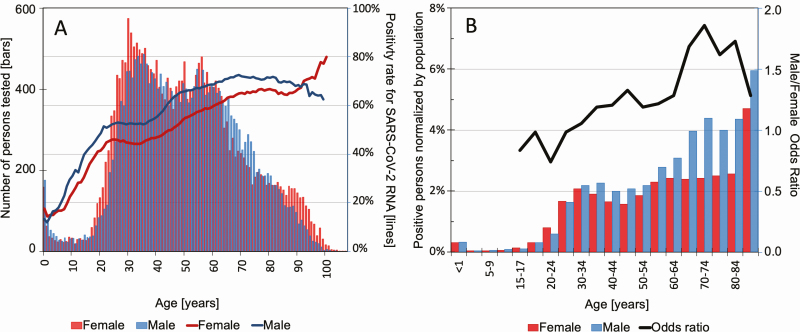
Demographics of the tested population. A, Left axis: number of persons tested by age and gender. Each bar represents 1 year of age. The bar height represents the total number of persons of the particular age who were tested by Northwell Health Laboratories, and the color represents an interspaced histogram of females (red) and males (blue). Right axis: test percentage of positivity rates, as a function of age; females (red) and males (blue). B, Percentage of persons of the same age and sex in the state of New York expected to be infected by SARS-CoV-2. Each bar represents a hemi-decile age bracket: female (red) and male (blue) are shown as separate bars. The bar height represents the percentage of New York State persons of the particular age and sex estimated to be infected with SARS-CoV-2, based on the number of positive results obtained by Northwell Health Laboratories, corrected on a per-county basis for the fraction of the total state SARS-CoV-2 testing performed by Northwell Health Laboratories, and then normalized to respective county population demographics using the 2010 census. The line represents the male to female odds ratio for each hemi-decile age bracket. The horizontal straight reference line at the value of 1.0 denotes an equal odds of men and women being infected with SARS-CoV-2. Abbreviation: SARS-CoV-2, severe acute respiratory syndrome coronavirus 2.

