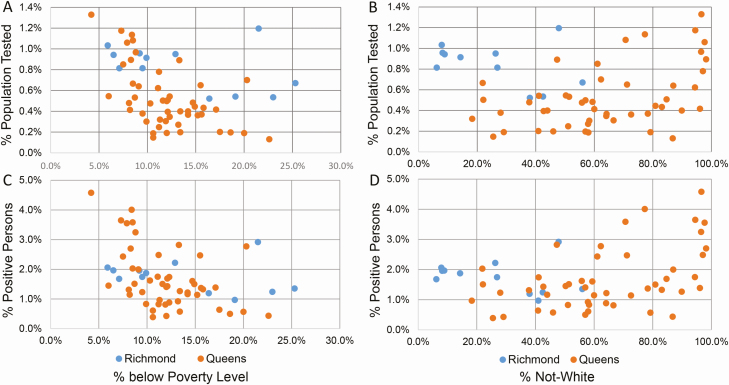
Figure 3.
Northwell SARS-CoV-2 testing by socioeconomic factors. Each point represents a zip code. A, Linear plot of zip code percentage of population tested as a function of percentage of persons below the poverty level. B, Linear plot of zip code percentage of population tested as a function of percentage of persons not White. C, Linear plot of the zip code percentage of SARS-CoV-2–positive persons as a function of the percentage of persons below the poverty level. D, Linear plot of the zip code percentage of SARS-CoV-2–positive persons as a function of the percentage of persons who were not White. Inclusion criteria for all panels were regional counties for which Northwell Health Laboratories provided greater than 10% of SARS-CoV-2 testing and individual zip codes with at least 10 tested persons. The data represent 26.2% of all SARS-CoV-2 tests performed in Richmond County from 4 March to 10 April 2020 (4059 persons, 12 zip codes) and 21.4% of all tests performed in Queens County (9831 persons, 49 zip codes). Abbreviation: SARS-CoV-2, severe acute respiratory syndrome coronavirus 2.

