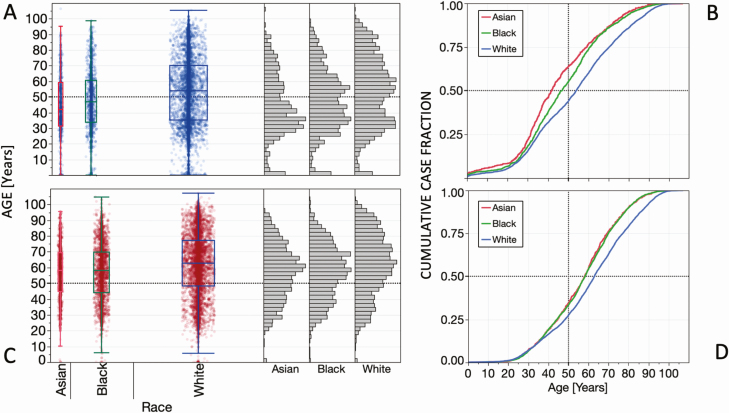
Figure 5.
SARS-CoV-2 test results by race and age. A, Box-and-whisker plot of negative test results by age for Asian (n = 594), Black (n = 1461), and White (n = 5075) persons, with means and 95% confidence intervals shown. The separation of the vertical displays reflects the number of persons tested per racial group. The adjacent histograms show the relative age distribution of negative test results for each race. B, Cumulative case distribution by age for Asian, Black, and White persons testing negative for SARS-CoV-2. C, Box-and-whisker plot of positive test results by age for Asian (n = 979), Black (n = 3073), and White (n = 6385) persons. D, Cumulative case distribution by age for Asian, Black, and White persons testing positive for SARS-CoV-2. Abbreviation: SARS-CoV-2, severe acute respiratory syndrome coronavirus 2.

