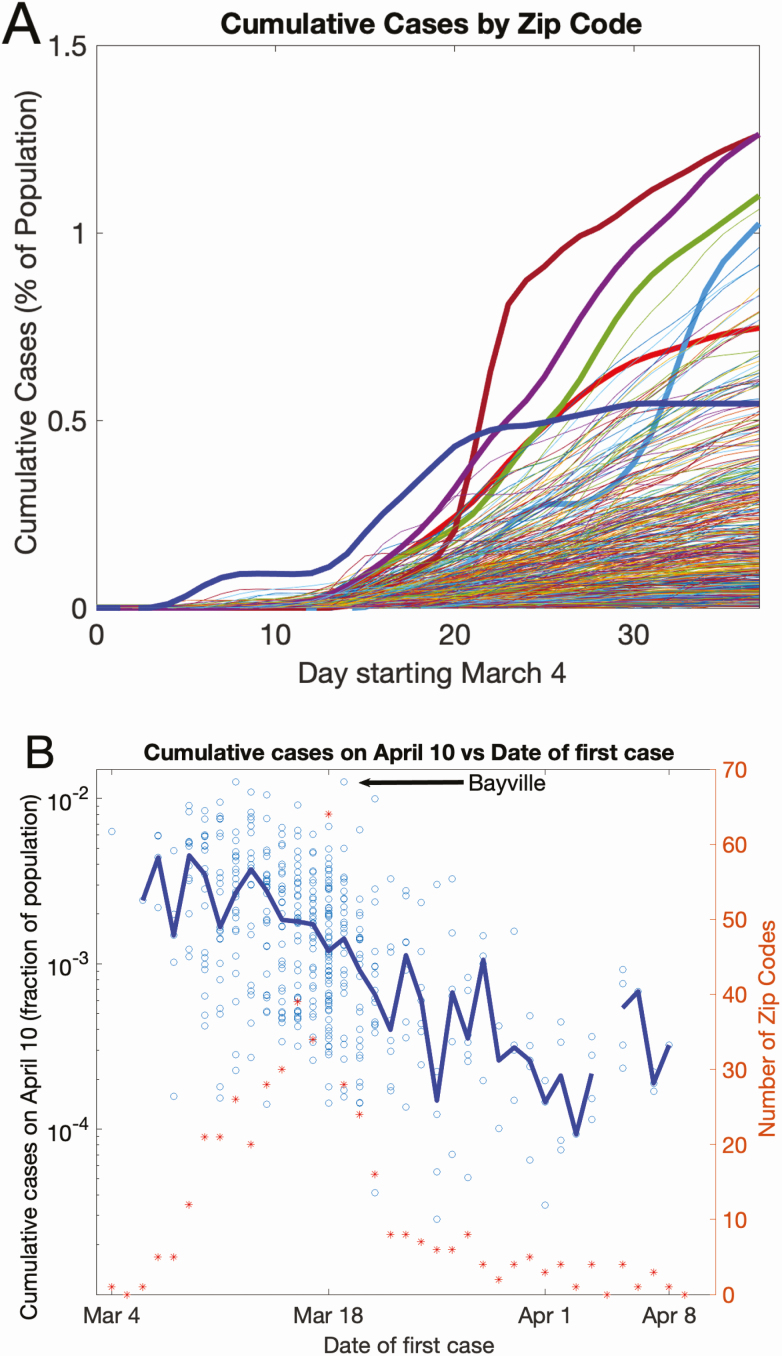
Figure 7.
Variation in cumulative case incidence by zip code. A, Cumulative case incidence by zip code, as a function of calendar date. Five zip codes are highlighted in bold, to show the diversity in case accrual. B, Cumulative cases on 10 April as a function of days elapsed since detection of the first case. Each symbol represents a single zip code. The x-axis value is the calendar date the first case in a given zip code appeared. The left y-axis value is the cumulative SARS-CoV-2 case incidence, as a fraction of the population in that zip code on 10 April. A total of 501 zip code areas are represented. The blue line connects the median values of the fraction of population infected across zip codes, as a function of the date of first case incidence. The diversity in case accumulation per zip code is shown by the wide dispersion of symbols on this semi-log plot, for the fixed date of the first case in any given zip code. The red asterisks and the right y-axis denote the number of zip codes acquiring a “first case” on any given calendar day. Abbreviation: SARS-CoV-2, severe acute respiratory syndrome coronavirus 2.

