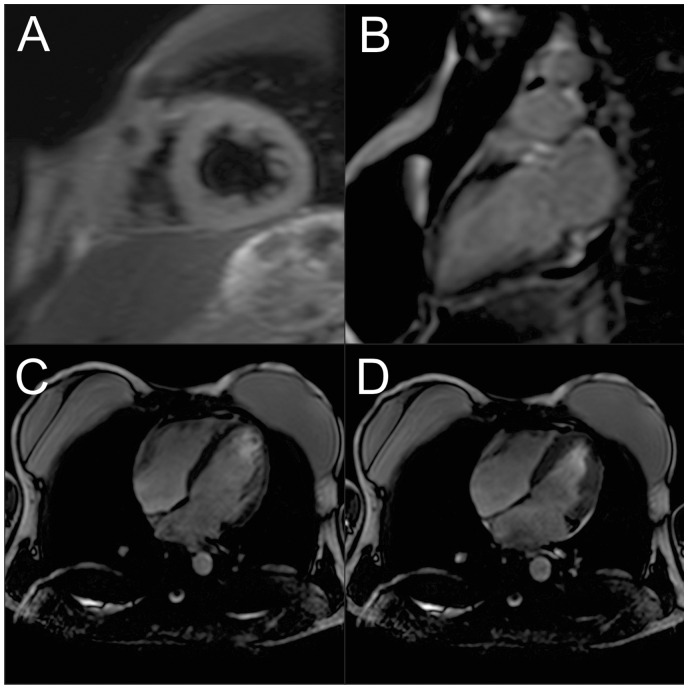
Figure 4.
Cardiac magnetic resonance imaging (MRI). (A) Left ventricular short-axis view using a short inversion time inversion recovery (STIR) T2-weighted showing the transmural extent of myocardial oedema to both ventricles. (B) Left ventricular long-axis view with inferobasal late gadolinium enhancement (LGE). (C and D) Long-axis view of the left ventricular end-diastolic and end-systolic using MRI with an ejection fraction of 60%.

