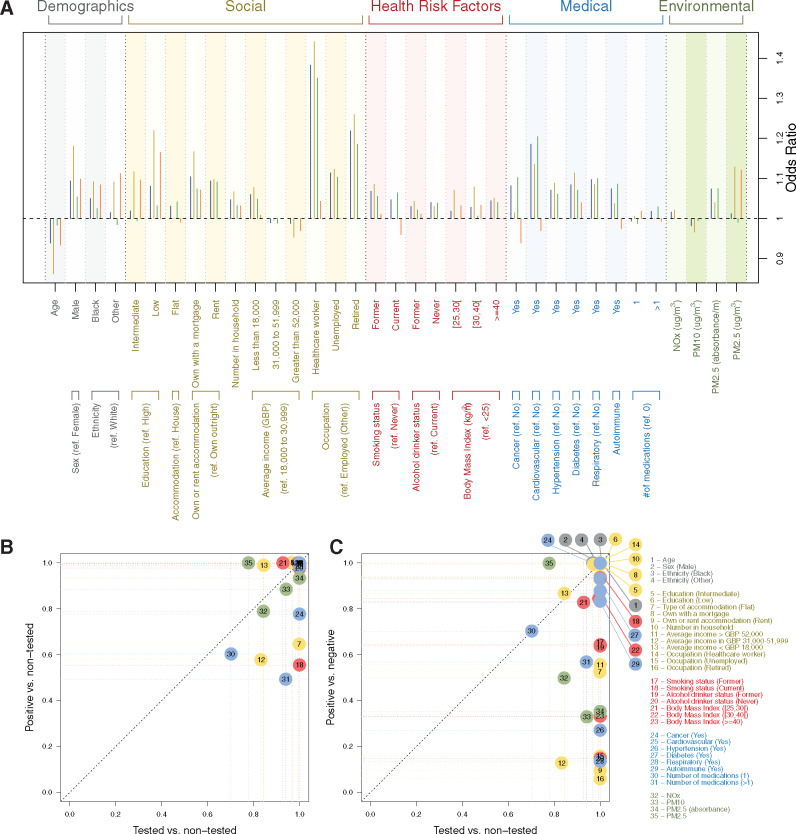
Figure 3.
Penalized odds ratios from logistic-LASSO models regressing jointly all predictors against the risk of (i) being tested for COVID-19 (outcome: tested vs non-tested, in blue), (ii) being tested positive for COVID-19 (outcome: tested positive vs non-tested, in beige), (iii) being tested negative for COVID-19 (outcome: tested negative vs non-tested, in green), and (iv) being tested positive conditionally on being tested (outcome: tested positive vs tested negative, in orange) (A). Selection proportion from stability analysis of the LASSO for (i) the risk of testing positive in the full population (B), and (ii) the risk of testing positive for COVID-19 conditionally on being tested (y-axis) (C) against the selection proportion for the model of the probability of being tested (x-axis). Selection proportions were inferred from 1000 models based on an 80% subsample of the population and are reported for each of the demographics (in grey, n = 4), social (brown, n = 12), health risk (red, n = 7), medical (blue, n = 8), and environmental (green, n = 4) factors.

