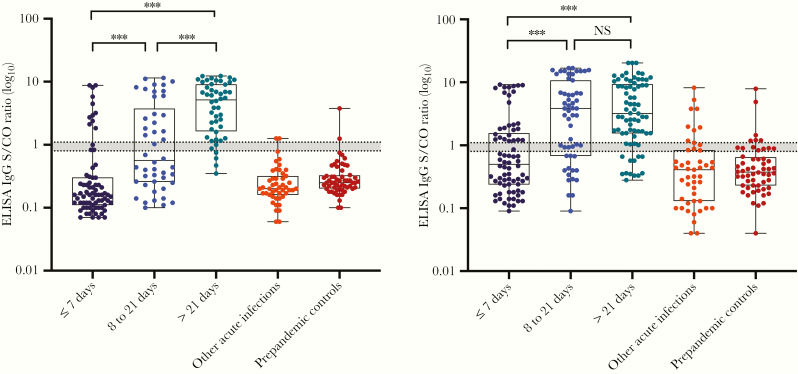
Figure 1.
Distribution of signal/cutoff ratios obtained for the EUROIMMUN IgG and IgA ELISA for SARS-CoV-2 cases stratified by time post symptom onset and control sera. Boxes represent median values and interquartile range, and whiskers represent maximum and minimum values. Dotted lines indicate the manufacturer’s cutoff values for interpretation of positive and negative test results, and the shaded grey area represents the range with borderline results. *** P value <.0001. Abbreviations: ELISA, enzyme-linked immunosorbent assay; IgA, immunoglobulin A; IgG, immunoglobulin G; NS, not significant; S/CO, signal/cutoff; SARS-CoV-2, severe acute respiratory syndrome coronavirus 2.

