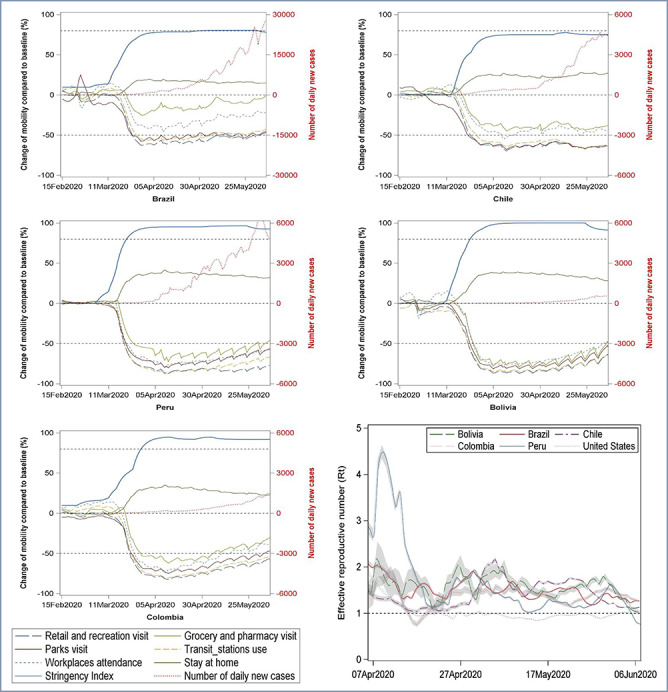
Figure 1.

The trajectory of SI, daily new cases, effective Rt, and changes of six categories of community mobility. (A serial interval with mean of 7.5 and a standard deviation of 3.4 days was used to calculate the Rt in window of 5 days. An exponentially weighted moving average method with parameter 0.3 was used to smooth time series of SI and number of daily new cases, and a base-10 log scale was used for the Y-axis for daily new cases)
