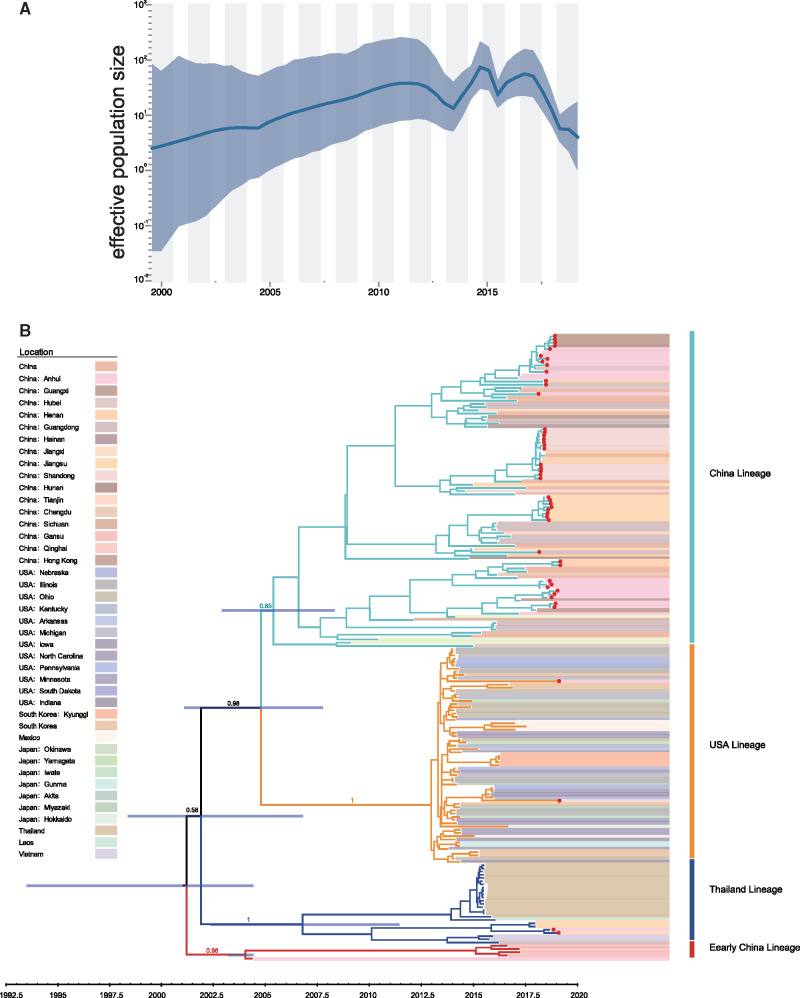
Fig. 4.
Demographic history of PDCoV in pigs. (A) Demographic history inferred via a skygrid coalescent tree prior. The intervals represent 95% HPD of the product of generation time and effective population size Ne(t). The middle line tracks the inferred median of Ne(t). (B) MCC tree of the S gene constructed using BEAST (version 1.10.5) under the skygrid nonparametric coalescent model. The red dots indicate strains were sequenced in this study.

