Figure 2.
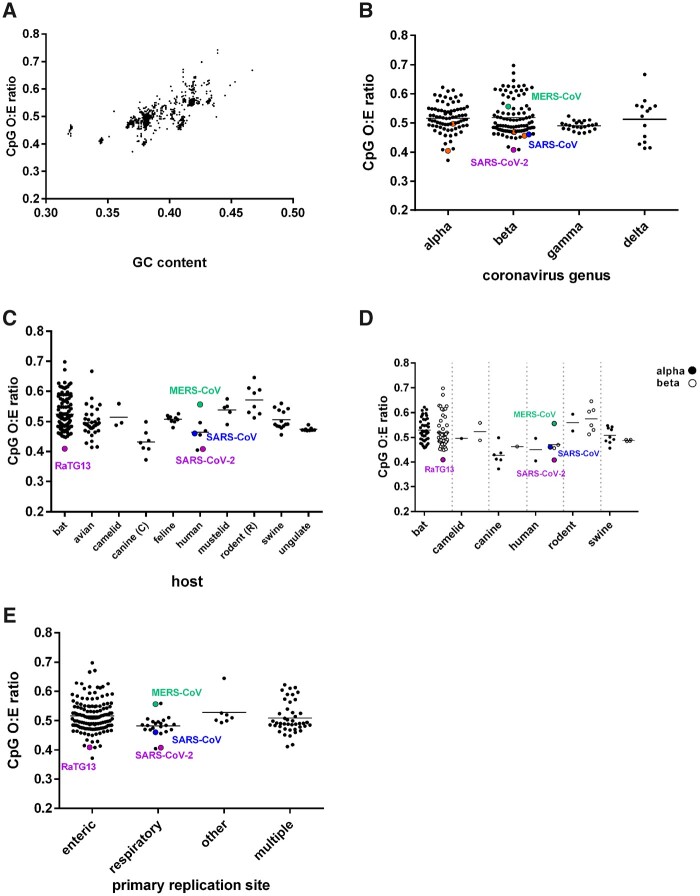
Comparison of the CpG ratios of complete genomes of coronaviruses. SARS-CoV is represented by a blue circle, SARS-CoV-2 and its related bat sequence RaTG13 by purple circles and MERS-CoV by a green circle throughout. A. GC content versus CpG ratio for all complete genome sequences of coronaviruses downloaded from Genbank (3407 sequences). The sequence dataset in (A) was then stripped to include only one representative from sequences with less than 10 per cent nucleotide diversity to overcome epidemiologic biases (215 representative sequences), which were analysed in the subsequent sub-figures. (B) Coronavirus genus against genomic CpG content. Other human-infecting coronaviruses HCoV-2292E, HCoV-NL63 (alphacoronaviruses) and HCoV-HKU1 and HCoV-OC43 (betacoronaviruses) are represented using orange circles. C. Vertebrate host of coronavirus against genomic CpG content. (D) Vertebrate host of coronavirus, with further sub-division into coronavirus genus, against genomic CpG content. Alphacoronaviruses are denoted with filled circles and betacoronaviruses with open circles. (E) Primary replication site against genomic CpG content by host. For a full breakdown of how these were assigned, please refer to Supplementary Table S1.

