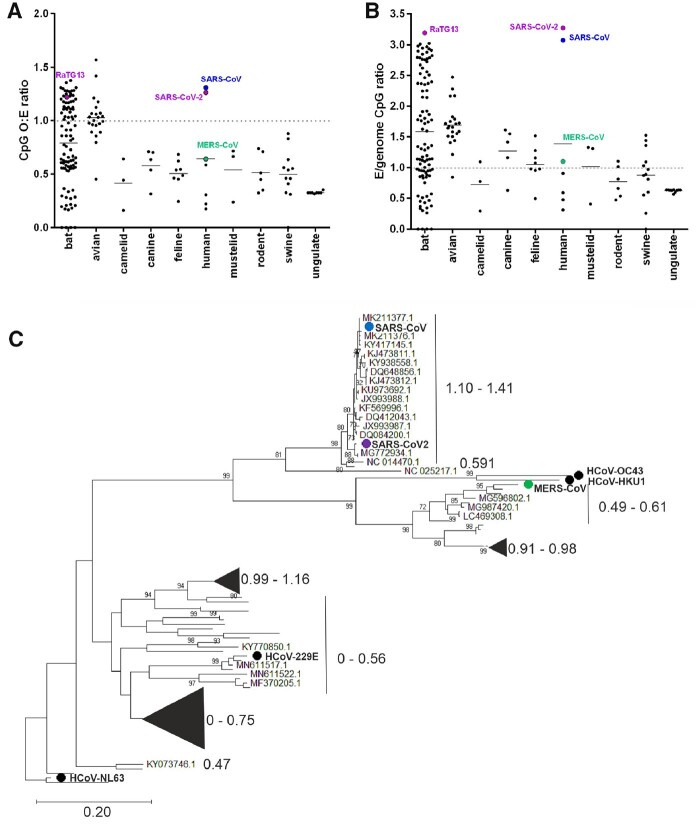
Figure 4.
Evolutionary conservation of E ORF CpG content. MERS-CoV (green circle), SARS-CoV (blue circle) and SARS-CoV-2 and its bat sequence relative RaTG13 (purple circles) are indicated in all panels. (A), CpG O:E ratios for E ORF for 178 coronavirus E ORFs are plotted by host. (B), CpG O:E ratios for E ORF were divided by the genomic CpG O:E ratio for 178 coronavirus sequences and grouped by host. (C), Phylogenetic reconstruction of E ORF of human and bat coronaviruses. Maximum composite likelihood tree (100 bootstraps) representing the seven human-infecting coronaviruses (HCoV-229E, HCoV-HKU1, HCoV-NL63, HCoV-OC43 are indicated by black circles) and 96 bat coronaviruses for which E ORF could be identified by alignment with the human coronaviruses. CpG O:E ratios for the E gene are indicated by large font numbers, and the sequences to which they relate are either bracketed or represented by triangles scaled to indicate the number of sequences they represent.

