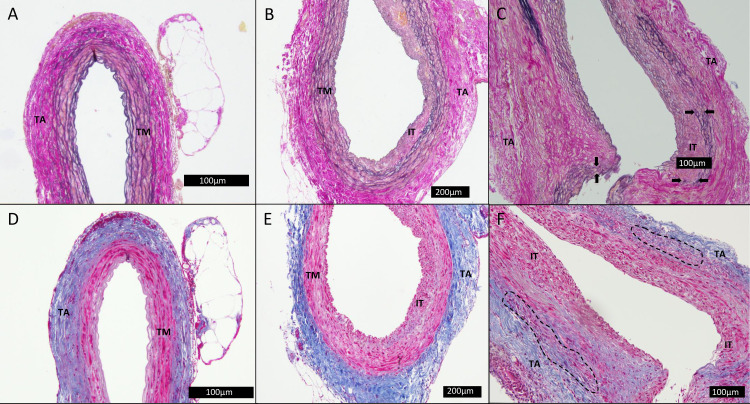
Fig 4. Histological slices of the abdominal aorta.
The slices, A-C, were stained with Millers elastin stain, while the slices, D-F, were stained with Masson trichrome. Slice A and D were neighboring slices from same rat in the saline group, slice B/E were from the PGG group and C/F from the control group. TA: tunica adventitia. TM: tunica media. IT: intraluminal thrombus. Black arrows: marking of defragmentation. Dashed line: example of area with neovascularization and infiltrating leucocytes.

