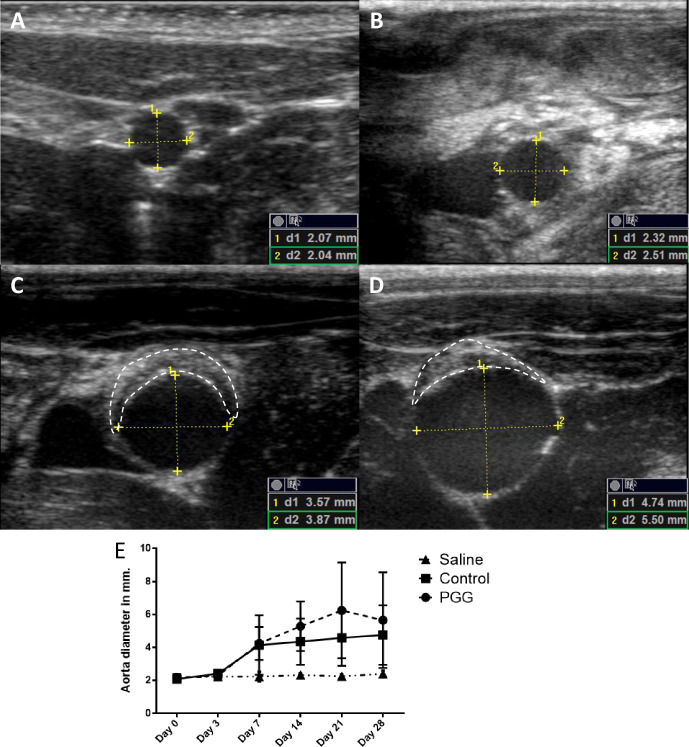
Fig 5.
Ultrasonic pictures of the infrarenal aorta of a rat in the elastase treated group at day 0 (A), day 3 (B), day 7 (C) and day 14 (D). The clear development of dilatation of the infrarenal aorta was seen, as well as intraluminal thrombus formation (the area within the dashed white line) from day 7. The yellow markings showed the points of measuring both dilatation in AP plane (1) as well as horizontal plane (2). The schematic development of dilatation in the infrarenal aorta was visualized in both the saline (triangle), control (square) and the PGG (circle) treated group, though no dilatations were seen in the saline treated group (E). Data are presented as mean ± SD.

