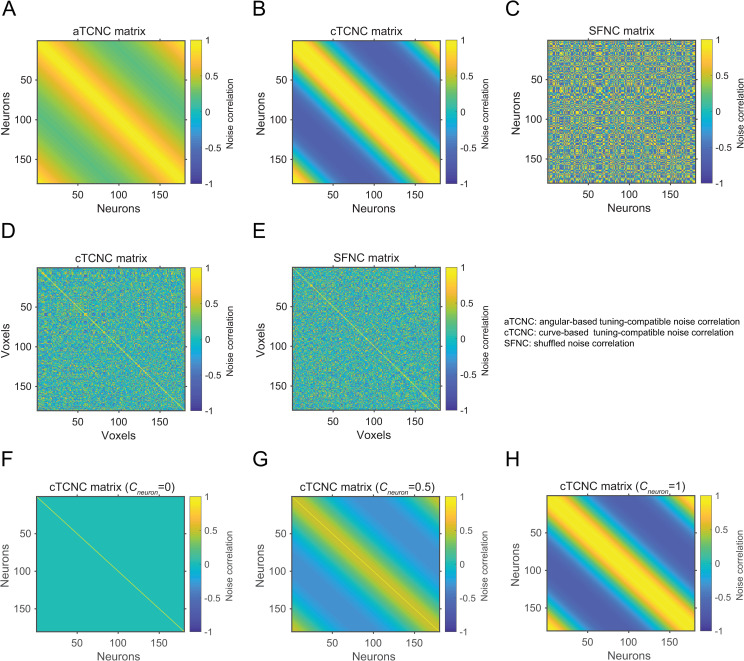
Fig 3.
Example noise correlation matrices simulated in a neuronal (panels A-C) and a voxel population (D, E). In the neuronal population (180 neurons), the angular-based TCNC matrix, the curve-based TCNC matrix, and the SFNC matrix are illustrated from left to right. Neurons are sorted according to their preferred orientation from 1 to 180°. In the voxel population (180 voxels), the curve-based TCNC matrix and the SFNC matrix are illustrated. Note that we do not sort the voxels according to their tuning preferences. The NC coefficients (cneuron or cvxs) are set to 1 in matrices from A-E. Panels F-H illustrate the cTCNC matrices with NC coefficient (cneuron) values 0, 0.5 and 1, respectively. Note that panels B and H are identical.

