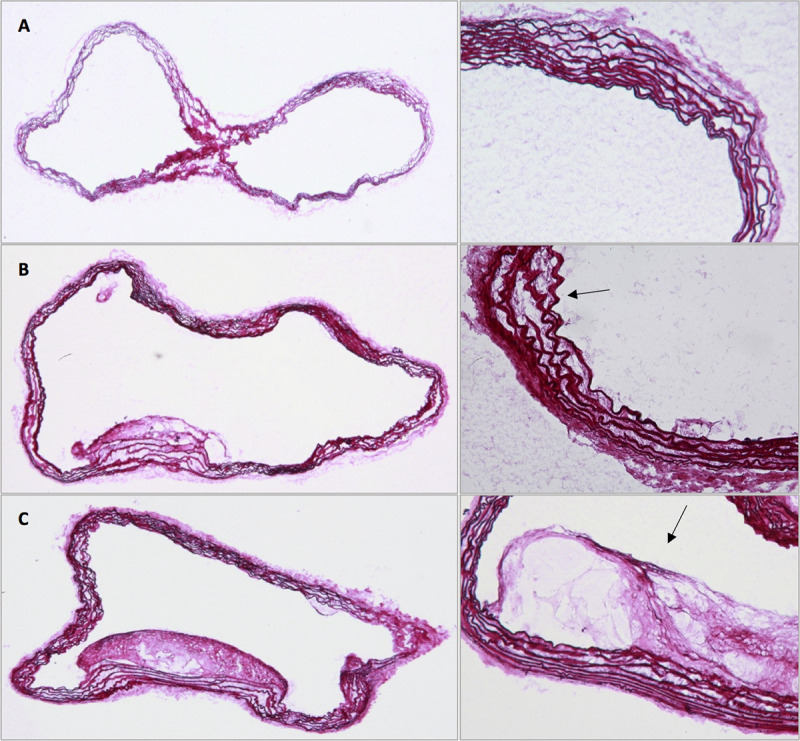
Fig 6. Elastica van Gieson analysis in the Chow Diet group.

Comparison at the first (A), second (B) and third (C) measurement point; Elastin fragmentations and plaques indicated by black arrows.

Comparison at the first (A), second (B) and third (C) measurement point; Elastin fragmentations and plaques indicated by black arrows.