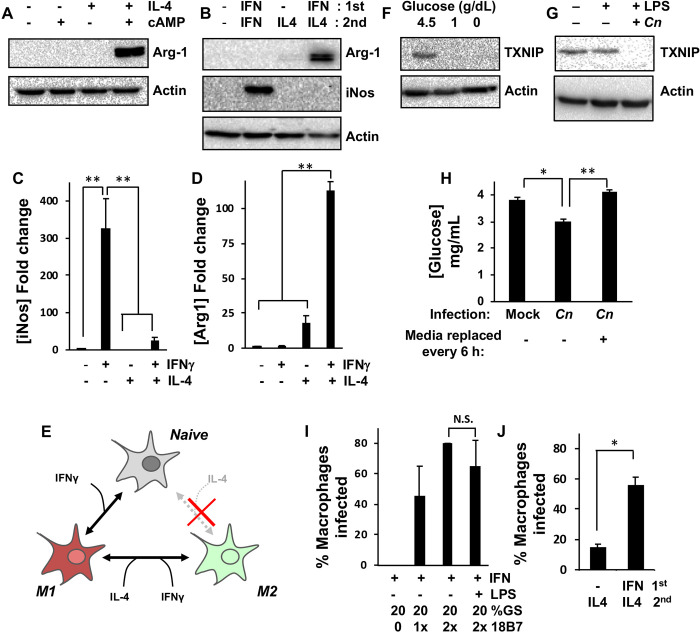
Fig 1. Optimization of murine macrophage intracellular Cn infection for transcriptome profiling.
Western blot analysis of RAW264.7 macrophages for M1 (iNos) and/or M2 (Arg-1) marker proteins after incubation for 24 h with (A) IL-4 and cAMP or (B) IFNγ and IL-4. (C) iNos and (D) Arg-1 levels in (B) were quantified by densitometry based on six discrete biological repeats. (E) Schematic to summarize data from (A-D), which suggests that while RAW264.7 cells cannot be directly polarized from M0 to M2 by IL-4 treatment, they can be repolarized from M1 to M2. Expression of TXNIP, a marker of glucose levels, as measured in RAW264.7 macrophages by western blotting after 24 h (F) incubation in growth medium containing the indicated glucose concentrations or (G) infection with 18B7-opsonized Cn. LPS was added for 2 h during infection to promote phagocytosis of Cn. (H) Glucose concentration as measured in RAW264.7 macrophage growth medium using a glucose oxidase assay kit 24 h post-mock or Cn-infection. Complete replacement of growth medium at 6 h intervals to remove extruded Cn prevents glucose depletion. (I and J) The percentage of Cn-infected RAW264.7 cells was quantified by confocal microscopy 24 h post-infection. For all experiments, concentrations are as follows: 200 U/mL IFNγ, 100 ng/mL IL-4, 1 μg/mL LPS, cAMP is 0.5 mM 8-Br-cAMP, 1× 18B7 is 10 μg per 1.5 × 10⁶ Cn, GS is goat serum. Error is represented as S.E. Statistical differences between samples were appraised using one-way analysis of variance (ANOVA) followed by a Tukey’s multiple comparison test. Statistical significance is indicated as follows: *, p < 0.05; **, p < 0.01. With the exception of (B-D), data is from three biological repeats.

