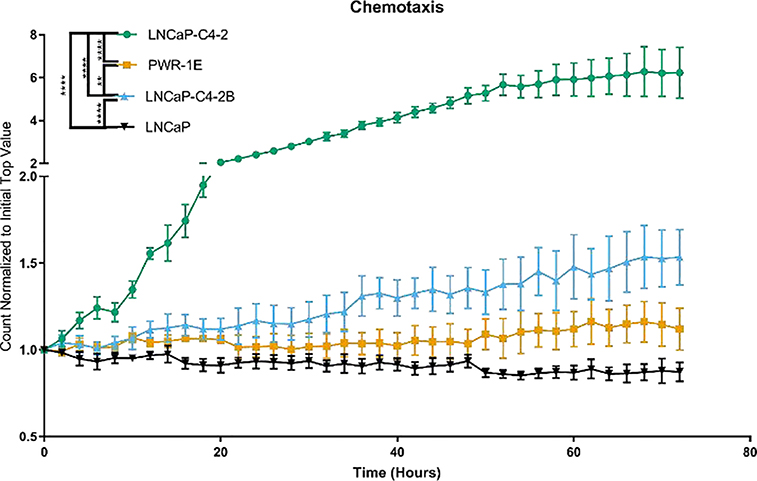
Figure 4.
Androgen independent prostate cancer cell lines demonstrate higher chemotaxis compared with the normal epithelial cells and androgen-dependent prostate cancer cell lines. Number of cells in the bottom well normalized to the initial top well represented as mean ± SEM. * represents p<0.05, ** represents p<0.005, *** represents p<0.001, **** represents p<0.0001 by two-way ANOVA with Tukey post-test.

