
Extended Data Figure 7. SEPHS2 and GPX4 expression in tumor microenvironments.
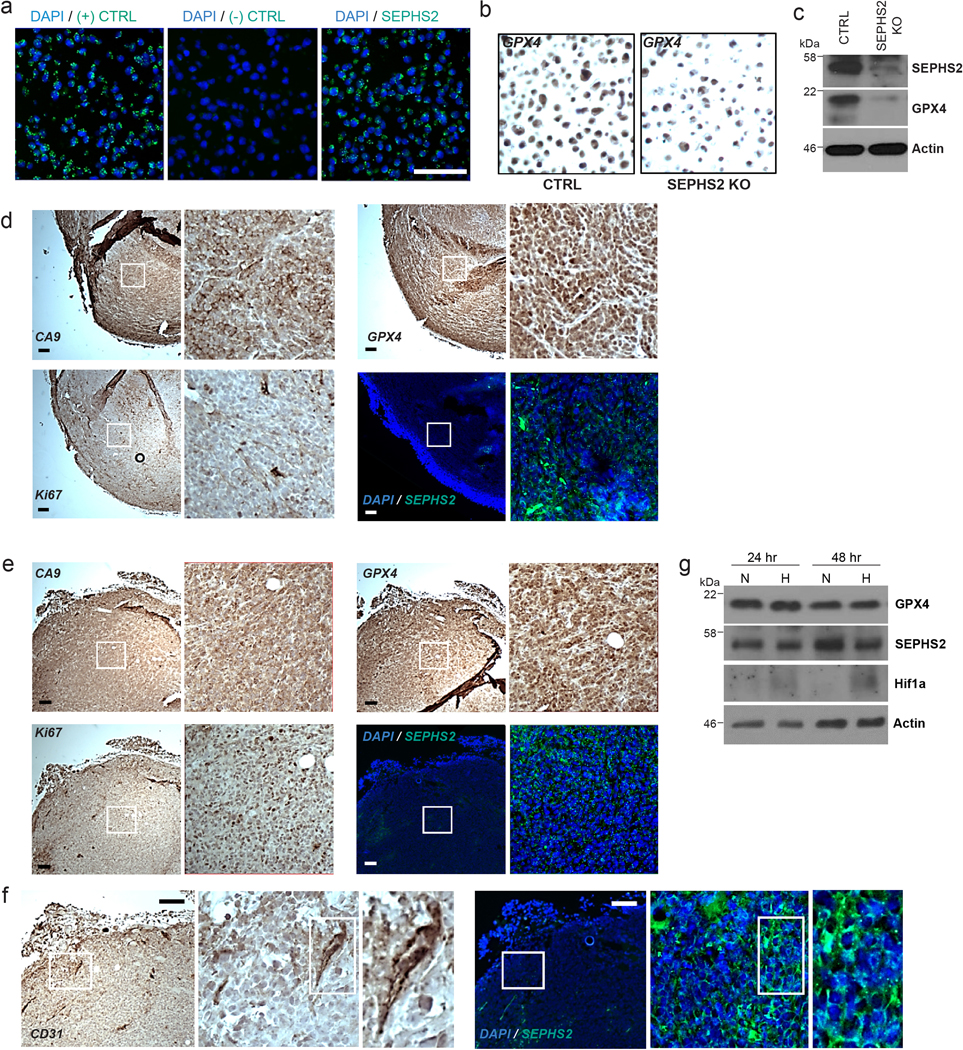
(a) Validation of SEPHS2 RNA probe by RNAscope in situ hybridization in MDA231 cell pellet block samples. Scale bar=100μm. (b) Validation of specificity of GPX4 antibody in CTRL and SEPHS2 KO MDAMB231 cell pellet block by immunohistochemistry. (c) SEPHS2 immunoblots from the cells used in b. (d and e) Micrographs of serial xenograft tumor sections stained with CA9, GPX4, KI67 antibodies and in situ hybridized with SEPHS2 RNA probe. The right hand panels are magnifications of the regions outlined by the white square. (d) shows a hypoxic region as indicated by membrane staining of CA9, and with a low Ki67 index. (e) shows a nonhypoxic region (as indicated by only background nonspecific stain in CA9) with a high Ki67 index. Scale bar is 100μm. (f) Micrographs of serial human tumor sections stained with CD31 antibody and in situ hybridized with SEPHS2 RNA probe, showing vasculature. Scale bar is 100μm. (g) Immunoblots of GPX4, SEPHS2 and Hif1a in MDAMB231 cells subjected to hypoxia (1% O2) for 48hrs.