
Extended Data Figure 10. Supporting data for flow cytometry and gas toxicity system.
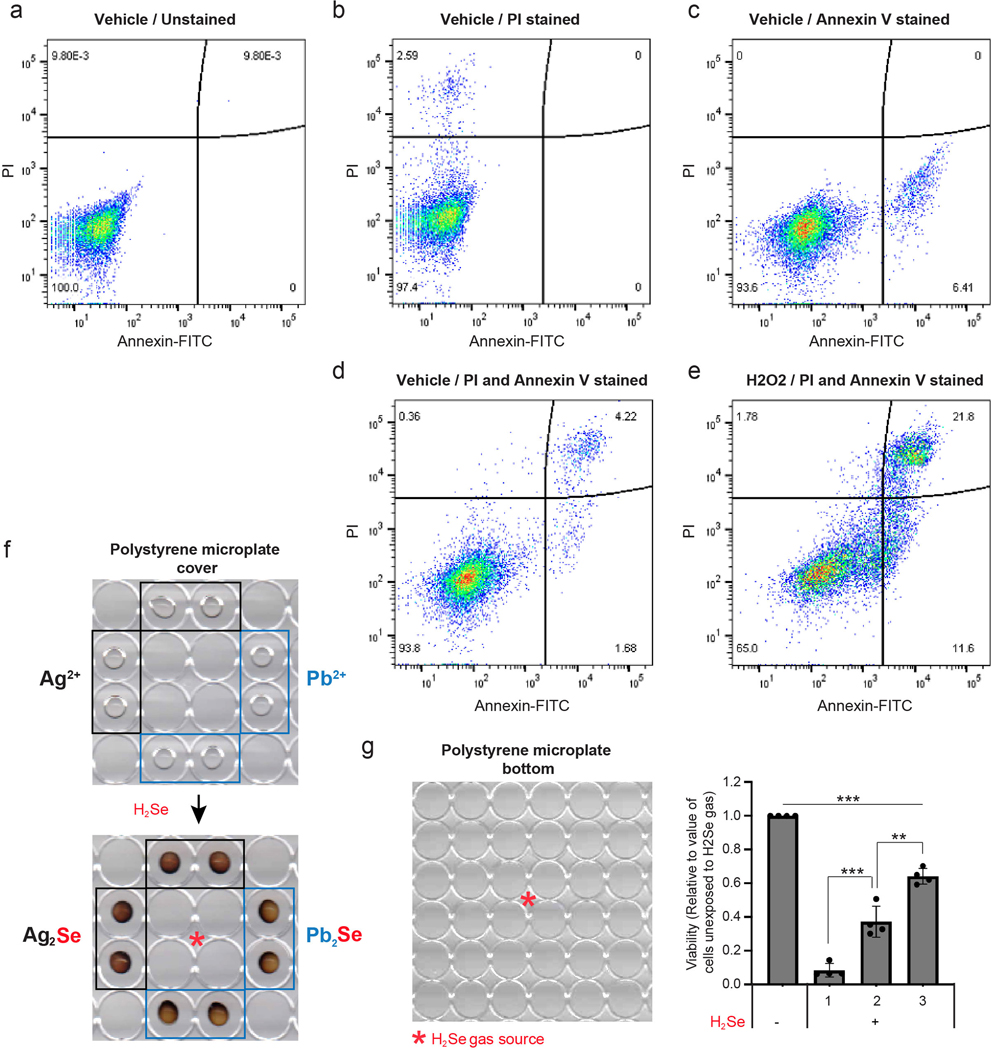
(a-e) Representative flow cytometry data to address gating and quadrant strategy for FACS measurement of dying/dead cells. MDAMB231 cells were stained with Annexin V-FITC and propidium iodide (PI). The X-axis and y-axis of Flow cytometry density plots were designated as Annexin V-FITC and PI, respectively. The left lower quadrant represents Annexin V negative and PI negative live cells. The right lower quadrant represents Annexin V positive and PI negative early dying cells. The right upper quadrant represents Annexin V positive and PI positive late dying/dead cells. Staining is as follows: (a) unlabeled, (b) PI, (c) Annexin V, (d) Annexin V and PI, (e) Annexin V and PI stained cells treated with 50 μM H2O2 for 24hr. (f) Scanned image of a polystyrene microplate cover with PVP spots embedded with silver nitrate or lead acetate. The plate cover was scanned before (upper panel) and after (lower panel) selenide gas exposure for one min. (g) Viability of MDAMB231 cells in the numbered spots outlined on the 96 well plate, exposed to selenide gas. For g, n=4 independent experiments; values are normalized to untreated cells (=1.0). For all panels, the measure of center is mean. For all panels **p<0.01, and ***p<0.001 (student’s two-tailed t test).