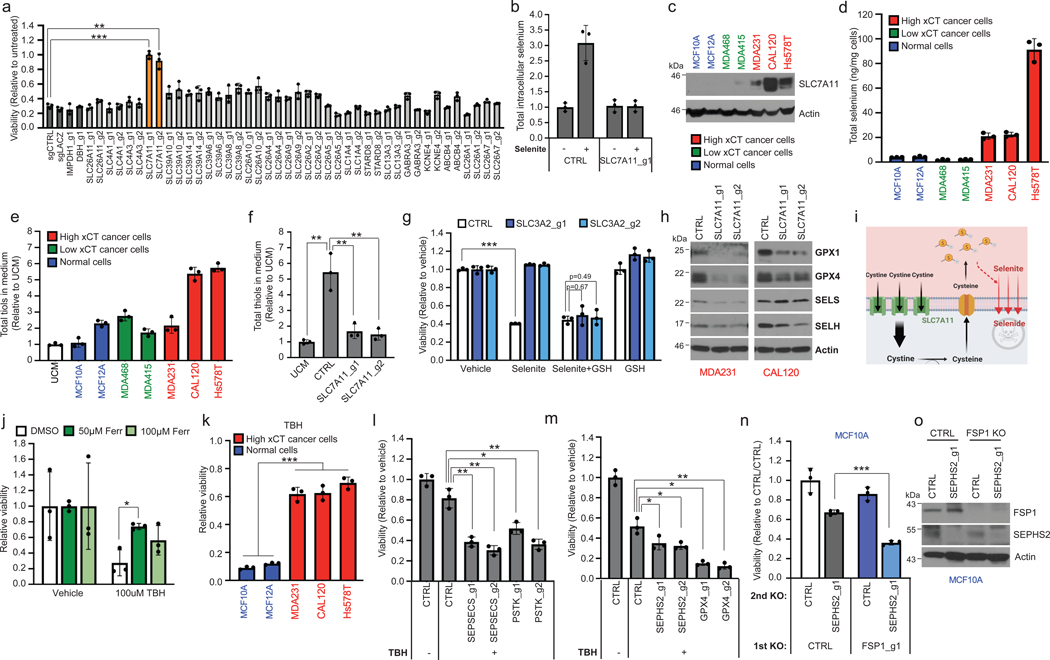
Figure 3. SLC7A11-mediated reduction of selenite is the initial step of the selenocysteine biosynthesis pathway in cancer cells, and protects against ferroptosis.

(a) Viability of U251 cells subjected to KO with guides against various control genes (dark gray bars) or against candidate selenium transporters, then 48h treatment with 12 μM sodium selenite. Values are relative to the same KO cells treated with vehicle (=1.0). (b) Selenium uptake in U251 cells either with or without SLC7A11 depletion. Total intracellular selenium was quantified following 12 μM selenite supplementation of for 2 hr in U251 cells. Values are relative to CTRL treated with vehicle (=1.0). (c) Immunoblots of SLC7A11 in a panel of breast cancer and normal breast lines. Non-cancer lines are in blue, low SLC7A11 expressing cancer lines are in green, and high SLC7A11 expressing cancer lines in red here and in subsequent histograms. (d) Selenium uptake in the same panel of lines. Total intracellular selenium levels were measured following treatment with 12 μM selenite for 2 hr. (e) Total thiol quantification of 24hr conditioned media from the panel. Each value was normalized to that of unconditioned media (UCM) for every thiol quantification assay. (f) Viability of control and SLC3A2 KO MDAMB231 cells treated with vehicle, 12 μM sodium selenite, and/or 75 μM reduced L-glutathione for 72 hr. Values are relative to the same cells treated with vehicle (=1.0). (g) Total thiol quantification of 24 hr conditioned media from CTRL KO and SLC7A11 KO MDAMB231 cells. (h) Immunoblots of selenoproteins in triple negative breast cancer cells subjected to KO with guides against SLC7A11 for 11 days. (i) Graphical summary of Figure 3. (j) Viability of MDA231 cells pretreated with ferrostatin for 3 hr and then treated with vehicle or 100μM TBH for 48 hr. Values are relative to the same cells treated with vehicle (=1.0). (k) Viability of selenophilic cancer cell lines (red) and nonselenophilic normal lines (blue) treated with 100μM TBH for 24 hr. Values are relative to the same cells treated with vehicle (=1.0). (l) Viability of MDA231 cells subjected to KO with guides against SEPSECS or PSTK for 5 days then treated with vehicle or 50μM TBH for 6 hr. Values are relative to the same cells treated with vehicle (=1.0). (m) Viability of MDA231 cells subjected to KO with guides against SEPHS2 or GPX4 for 5 days and then treated with vehicle or 250μM TBH for 24 hr. Values are relative to the same cells treated with vehicle (=1.0). (n) Viability of MCF10A cells subjected to sequential gene KO as shown. Values are relative to the cells subjected to CTRL KO then subjected to CTRL KO (=1.0). (o) Immunoblots of FSP1 and SEPHS2 from n. FSP1 expression did not significantly differ between SEPHS2 sensitive lines and insensitive lines (Extended Data Figs 6e). For a, d-g and j-n, n=3 biological replicates; for b, n=3 technical replicates; error bars are S.D. For d and e, while trends can be seen, statistical comparisons were not carried out due to variability between cell lines. For all panels, the measure of center is mean. For all panels, *p<0.05, **p<0.01, and ***p<0.001 (student’s two-tailed t test).
