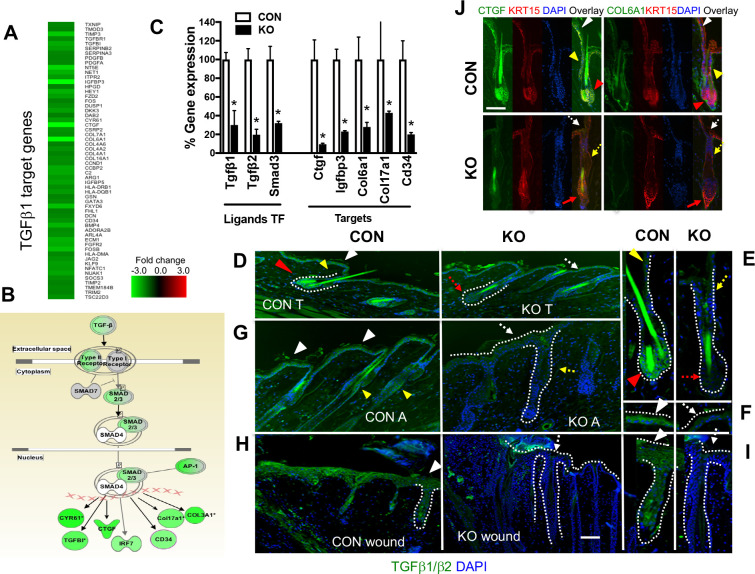
Fig 1. Med1 ablation reduces TGFβ signaling in the skin.
(A) Expression profiles of keratinocytes isolated from Med1 KO and CON mice (10wk) were compared by using microarray. The heat map (fold changes) shows that a number of TGFβ1 target genes are down-regulated in KO keratinocytes (green). (B) Pathway analysis (IPA) shows down-regulation of TGFβ pathway in KO keratinocytes. Down-regulated genes are shown by green color. (C) The mRNA levels of TGFβ ligands, signal transducer (SMAD3), and a series of TGFβ target genes in CON (open bars) and KO keratinocytes (closed bars). Percentage expression of KO compared to CON was calculated by qPCR measurements (mean +/- SD, n = 3, t-test * p<0.05). (D-I) Immuno-staining of TGFβ1/β2 in telogen (D), anagen skin (G), and wounded skin (1d) (H) of CON and KO skin. Green signals (TGFβ1/β2) overlaid with blue DAPI counterstain. Bars = 50 μm. The pictures were taken by the same exposure between CON and KO to visualize green signals in CON, that masks blue counterstain by overlay. However, the lack of green signal shows DAPI blue background in KO. The shape of HFs and edges of epidermis are shown by dotted lines. (E) Enlarged images of TGFβ1/β2 staining focused on HF in Fig D, in which HF is shown by dotted line. The locations of TGFβ1/β2 (green) are demonstrated by colored triangles; HF (red), isthmus (yellow) and IFE (white) in CON skin. Lack of the ligands in KO at equivalent locations is shown by dotted arrows by the same colors. (F) Enlarged images of TGF ligands in Fig D, focused on IEF (white arrows). (G) Immuno-staining of TGFβ1/β2 at anagen skin characterized in long HF. The location of the ligands is shown by colored triangles similar to telogen skin (D). (H) Immuno-staining of TGFβ1/β2 at wound edges of 1 d skin wounds. (I) Enlarged images of TGF ligands in Fig H, focused on HF/IFE region (shown by dotted lines) of wounded skin. (J) Immuno-staining of CTGF and COL6A1 (green, left panels), KRT15 (red, middle) and DAPI (blue, second from right), with merged images (right panels) of epidermis and HFs at 10 wk. Bars = 50 μm.

