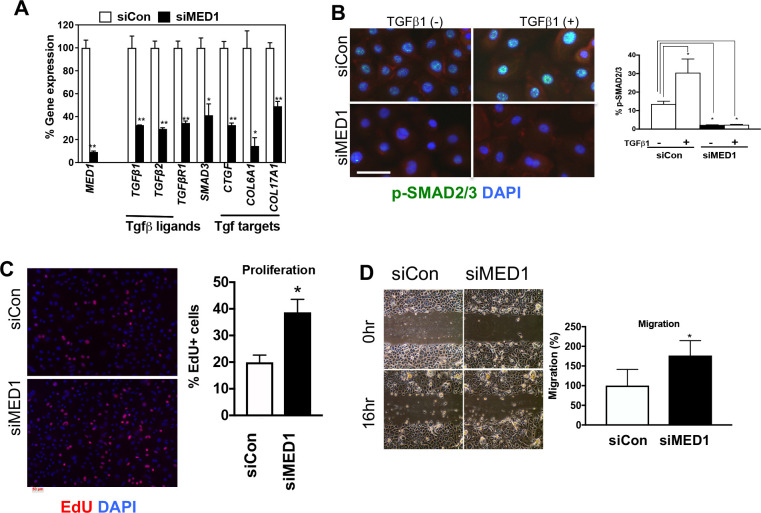
Fig 2. MED1 silencing suppresses TGFβ signaling in vitro.
(A) mRNA expression of MED1, TGFβ related genes in Med1 silenced (siMED1) and control (siCon) cells (qPCR, mean +/- SD n = 3, t-test, *p<0.05, **p<0.01). (B) Immuno-staining of p-SMAD2/3 (green) treated with or without rTGFβ1, red cytoplasmic β-catenin (red) with DAPI blue counterstain Bars = 50 um. Graph shows the number of nuclear p-SMAD2/3 positive cells (mean +/- SD, 3 fields, t-test, *p<0.05). (C) Cell proliferation evaluated by EdU (red). Graph shows quantitation of EdU positive cells per total cells (DAPI) (mean +/- SD, 5 fields, t-test, *p<0.05). (D) Photographs of monolayer culture of MED1 silenced cells (siMED1) and control cells (siCon) right after scratch (0h) and overnight culture (16hr) are shown. The migration was quantitated by measuring empty spaces remaining after cell migration (5 fields, t-test, *p<0.05).

