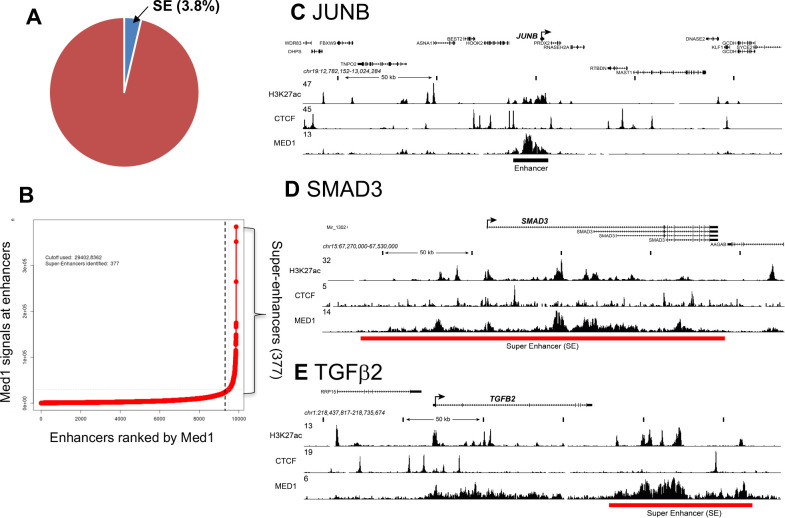
Fig 3. ChIP-seq identifies SEs in regulatory regions of TGFβ signaling genes.
ChIP-seq was conducted on cultured keratinocytes using antibodies against MED1, H3K27ac and CTCF. (A) The number of SEs (3.8%) and typical enhancers (9873) identified by MED1 peak calling are depicted schematically. (B) Distribution of MED1 ChIP-seq signals (total reads) across the typical enhancers, in which enhancers are ranked by increasing MED1 signal. With a subset of enhancers, 377 SEs were identified that contain exceptionally high amounts of MED1 (right side of dotted line). (C-E) ChIP-seq binding profiles (reads per million per base pair) for the H3K27ac (active histone), CTCF (DNA loop site) and MED1 at JUNB (C), SMAD3 (D), and TGFβ2 (E) loci in keratinocytes. Red and black bar represent SE and typical enhancer, respectively. Schematic models of SE and typical enhancer are shown in Fig 6.

